Model Apple's volatility
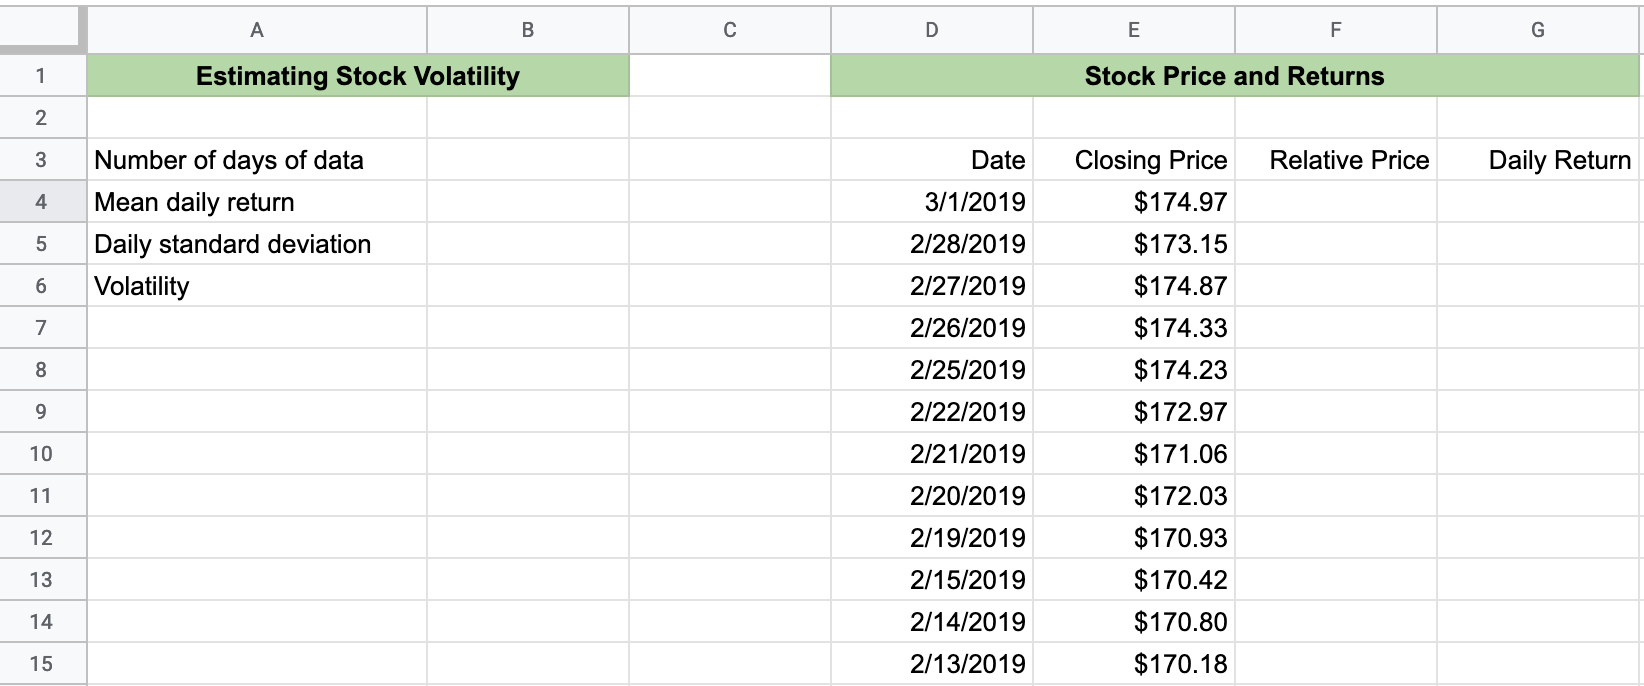
Relative price and daily return
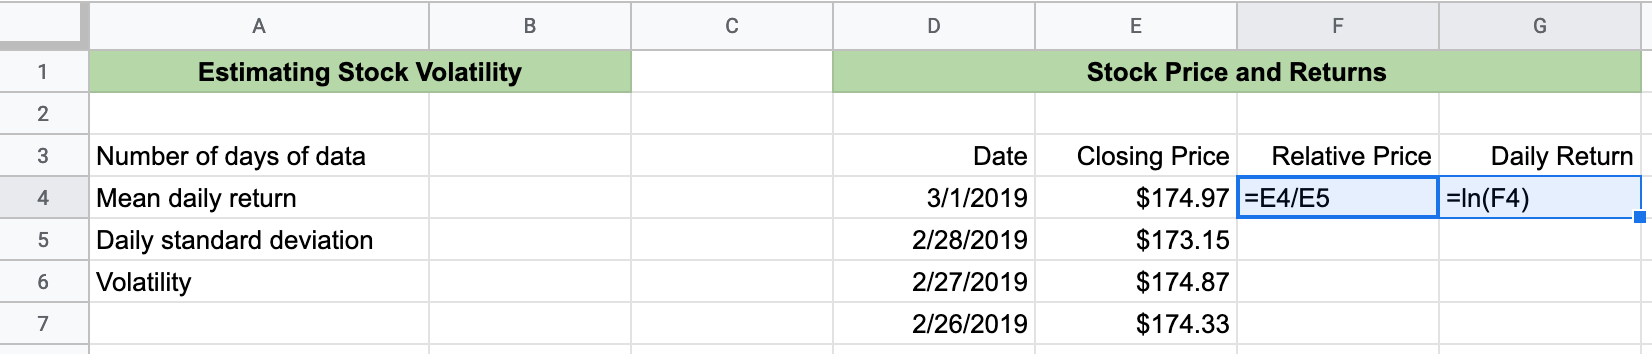
Relative price
= First Day / Previous DayNatural log function:
= ln(CELL)
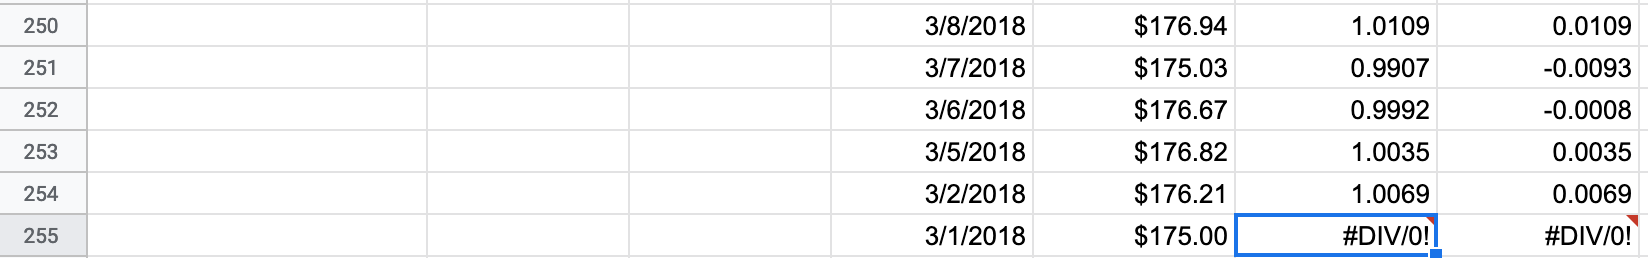
No #DIV/0!
Days of data
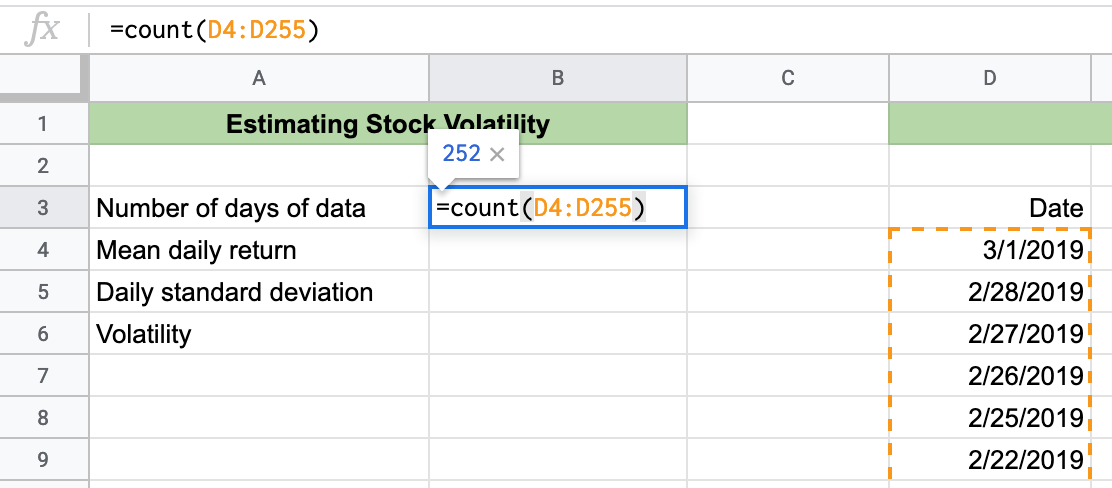
=count(CELL REFERENCES)
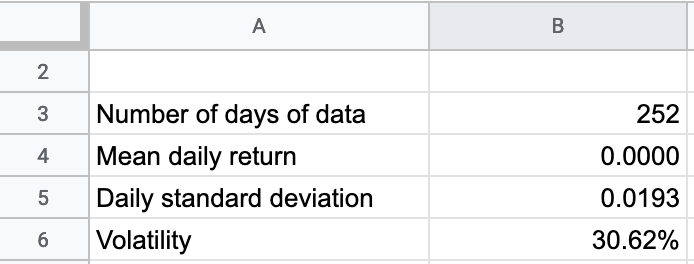
Descriptive statistics for Apple
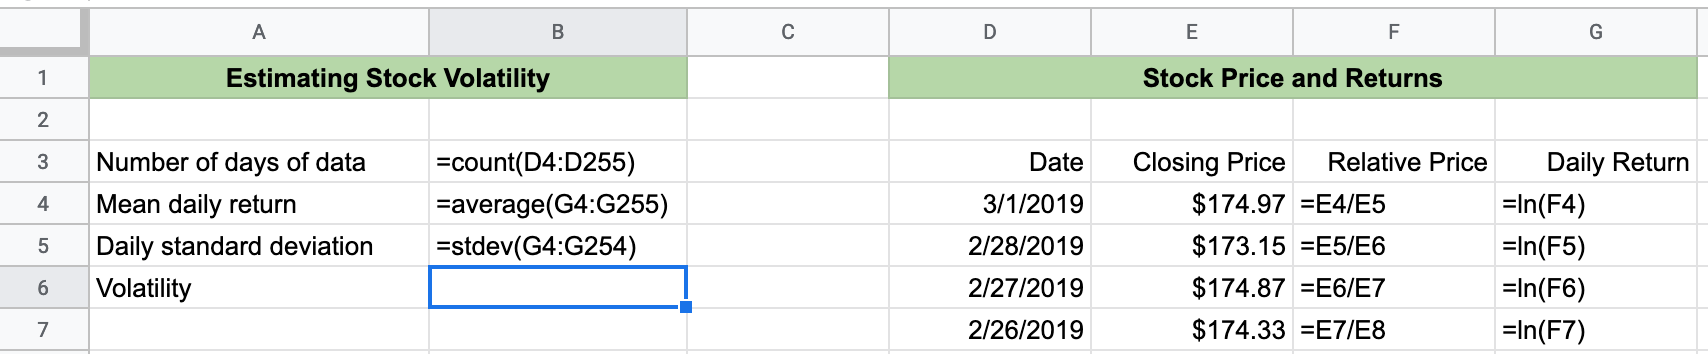
Mean:
=average(CELL REFERENCES)Standard deviation:
=stdev(CELL REFERENCES)
Annualize volatility
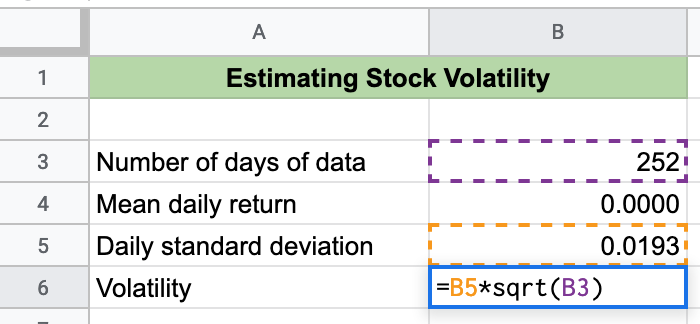
- Volatility:
=Daily Standard Deviation / sqrt(Time)
Apple's volatility uncovered