What is the most likely stock price?

Financial Modeling in Google Sheets

Erin Buchanan

Professor

Cumulative versus density probabilities

  • Cumulative probability - the probability of that value and all the values below it

  • Density probability - the probability of that value

  • normdist(x, mean, standard_deviation, cumulative)

Financial Modeling in Google Sheets

Cumulative probability

Cumulative Probability

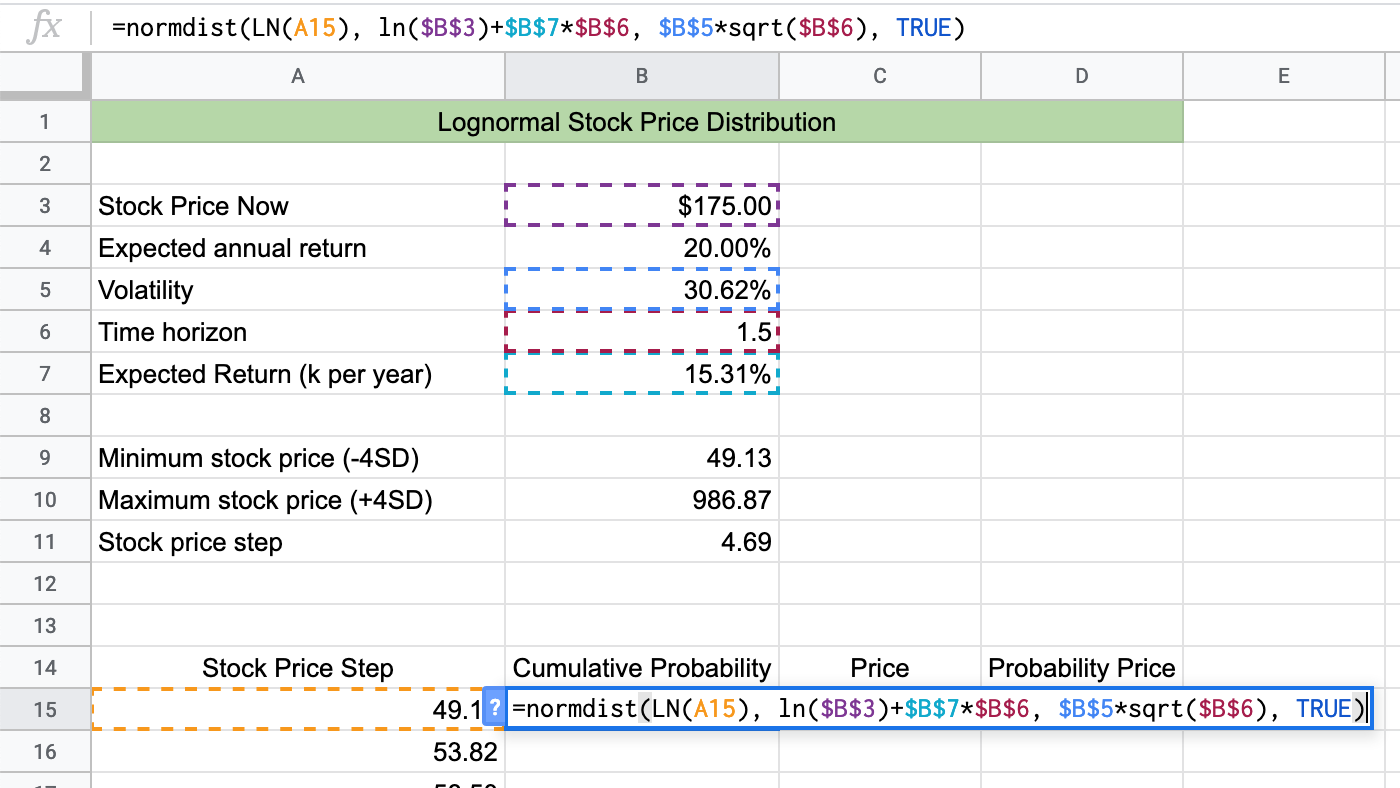
=normdist(LN(A15), ln($B$3)+$B$7*$B$6, $B$5*sqrt($B$6), TRUE)

Financial Modeling in Google Sheets

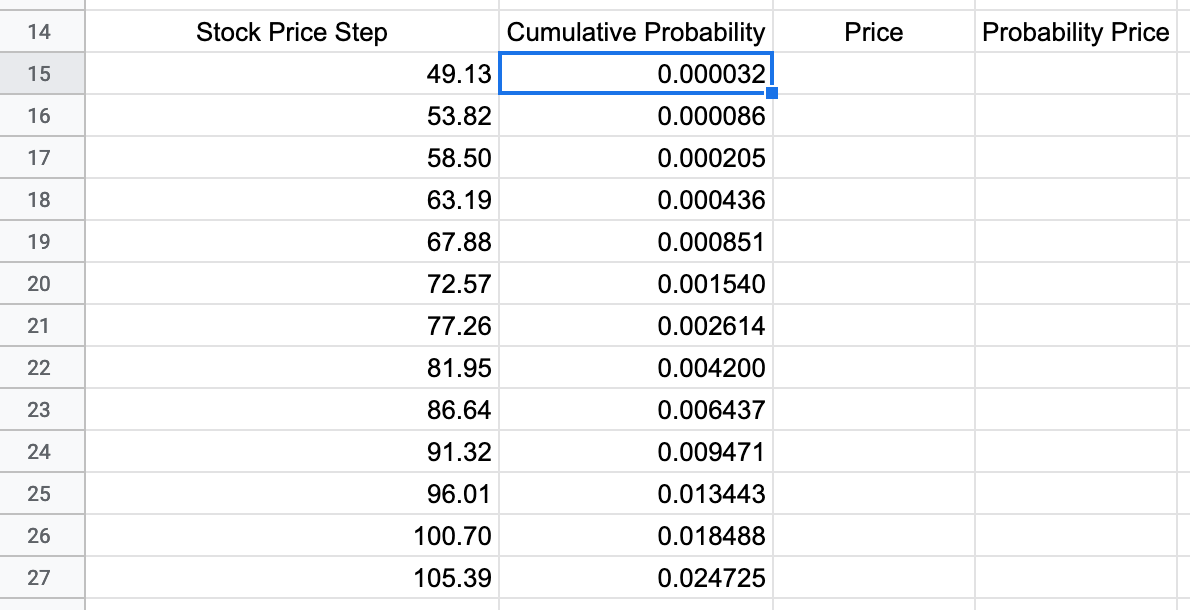
Cumulative probability check

Cumulative Probability Results

Financial Modeling in Google Sheets

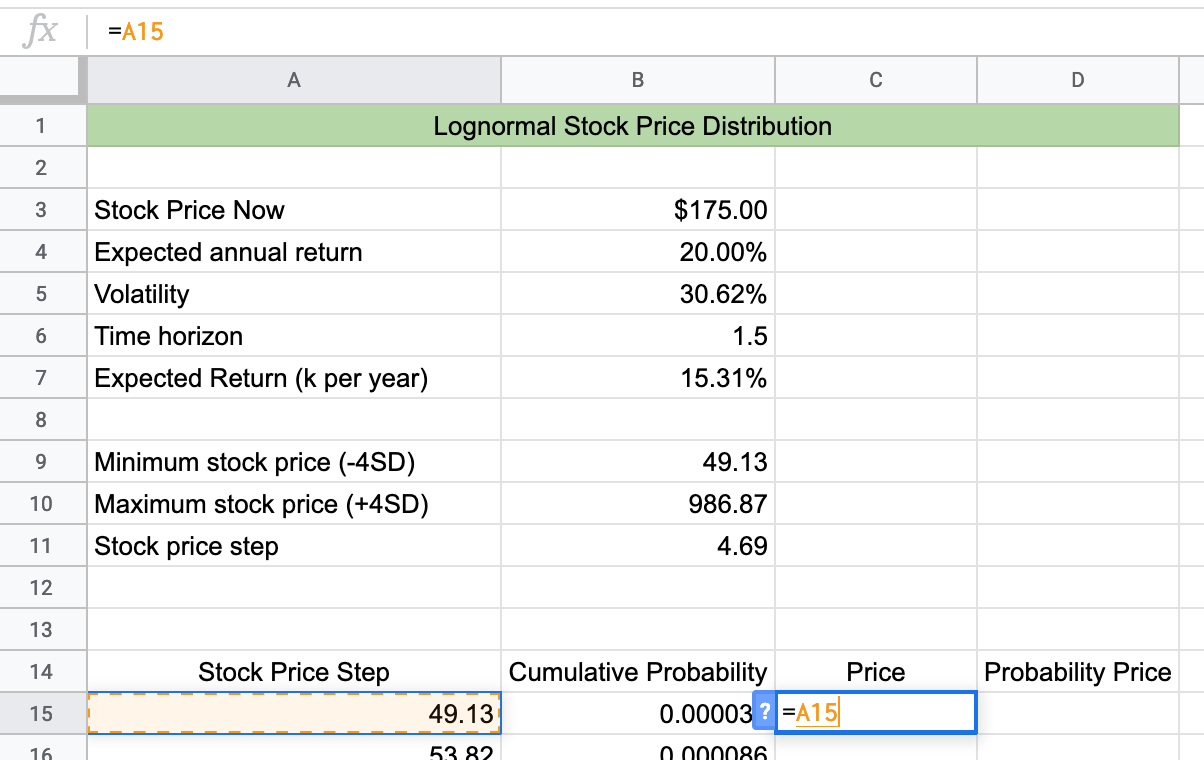
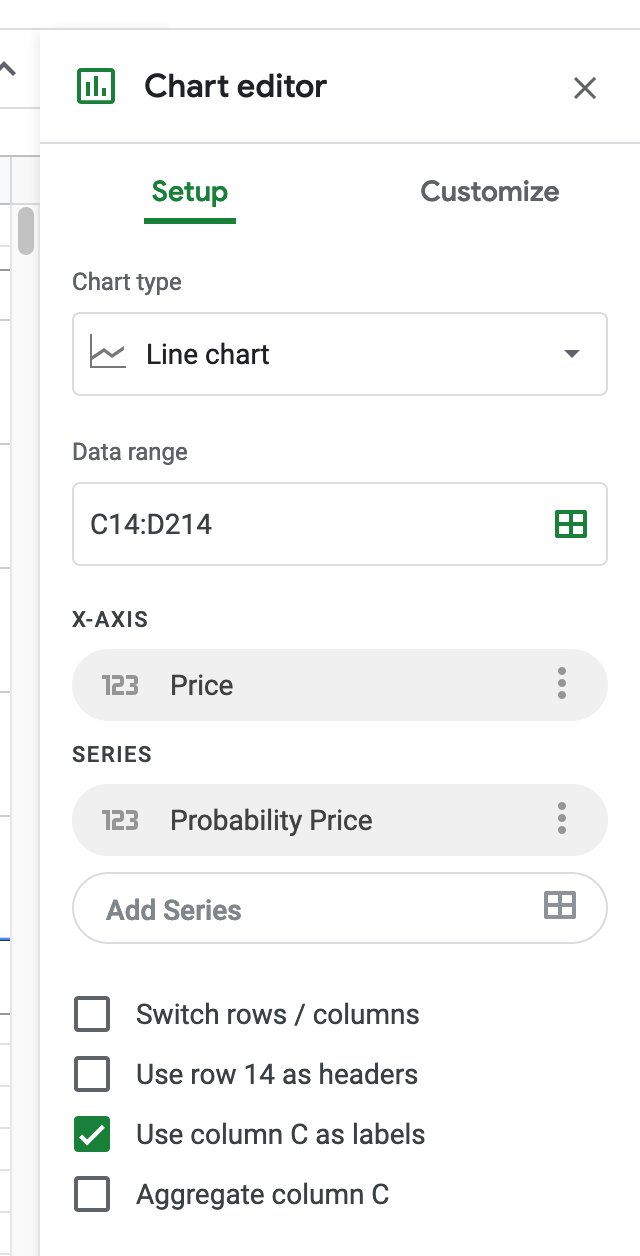
Price column for graphing

Add Price

Financial Modeling in Google Sheets

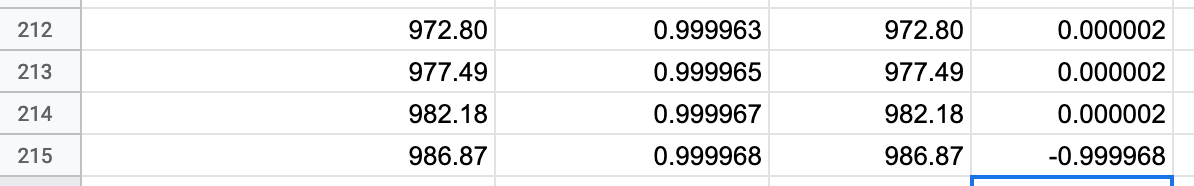
Density probabilities

Probability of Price

Financial Modeling in Google Sheets

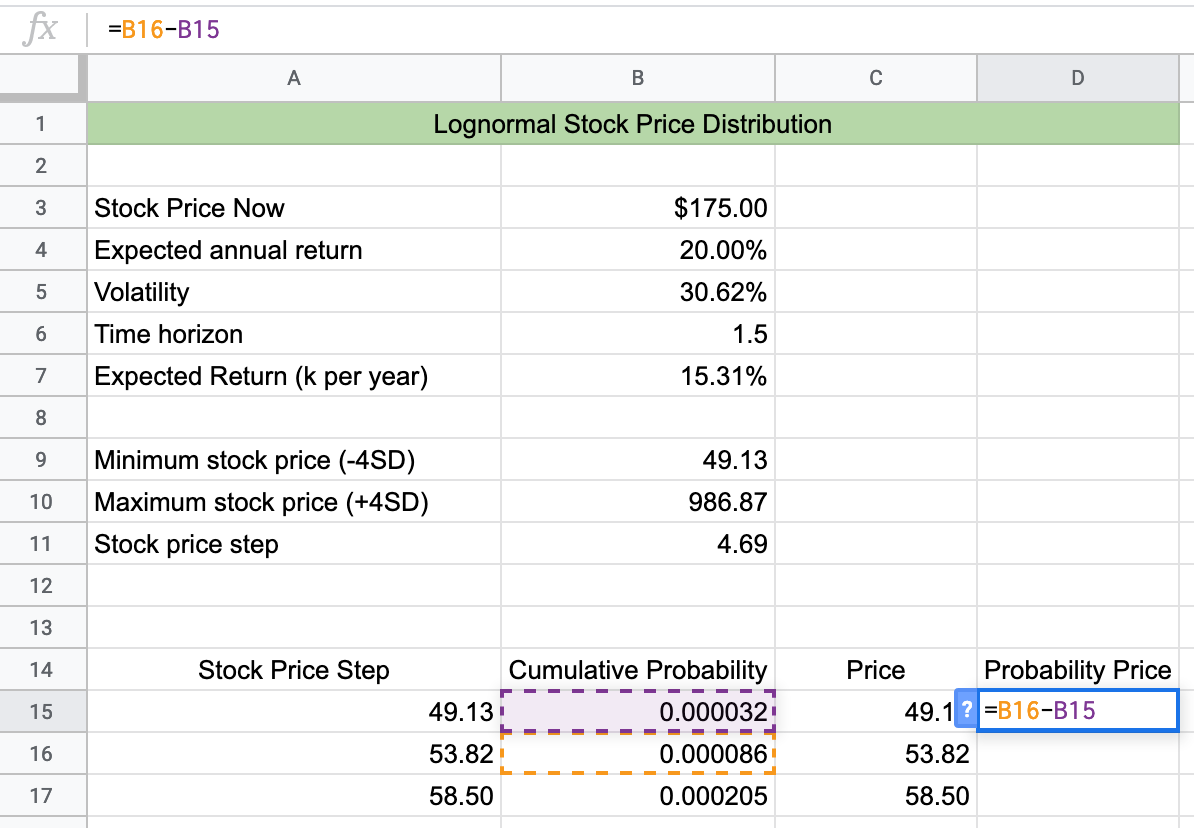
Copy the formula to all rows but the last

Delete last probability

Financial Modeling in Google Sheets

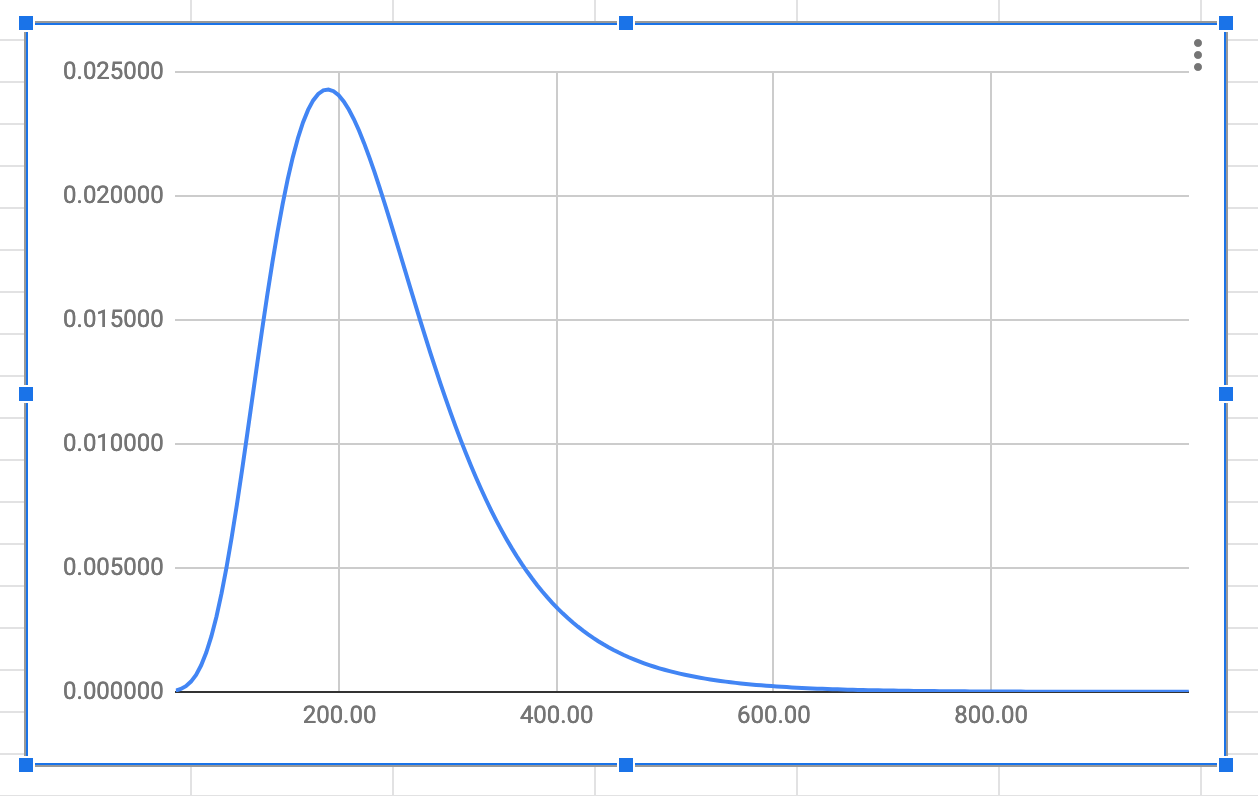
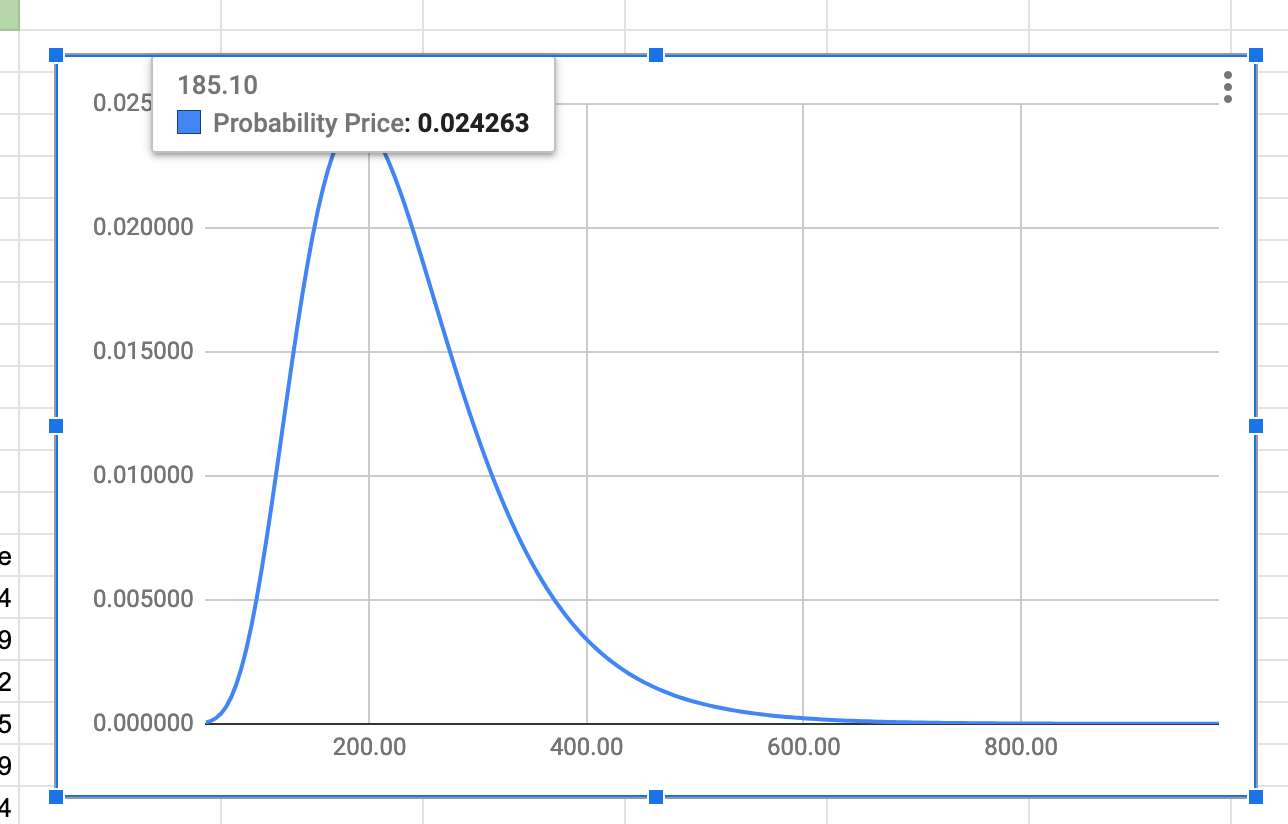
Graph the density function

Create Chart

  • Highlight price and probability
  • Click insert, then chart
  • Pick a line chart
  • Select use Column C as labels
Financial Modeling in Google Sheets

Lognormal stocks

Results Graph

Highest Probability

Financial Modeling in Google Sheets

Let's practice!

Financial Modeling in Google Sheets

Preparing Video For Download...