Hyperparameter Values
Hyperparameter Tuning in Python

Alex Scriven
Data Scientist
Automating Hyperparameter Tuning
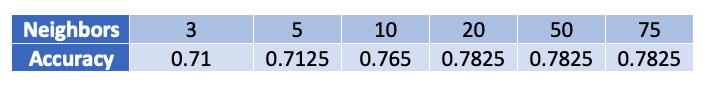
We can store the results in a DataFrame to view:
results_df = pd.DataFrame({'neighbors':neighbors_list, 'accuracy':accuracy_list})
print(results_df)
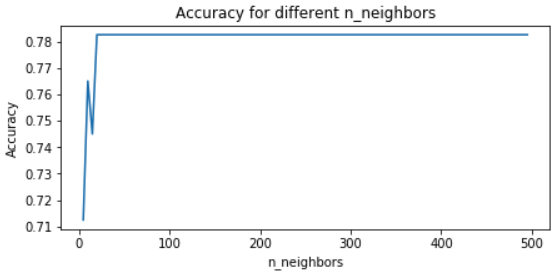
Learning Curves
Our graph: