Random Search in Scikit Learn
Hyperparameter Tuning in Python

Alex Scriven
Data Scientist
Comparing to GridSearchCV
We don't need to reinvent the wheel. Let's recall the steps for a Grid Search:
- Decide an algorithm/estimator
- Defining which hyperparameters we will tune
- Defining a range of values for each hyperparameter
- Setting a cross-validation scheme; and
- Define a score function
- Include extra useful information or functions
Comparing to Grid Search
There is only one difference:
- Step 7 = Decide how many samples to take (then sample)
That's it! (mostly)
Comparing Scikit Learn Modules
The modules are similar too:
GridSearchCV:
sklearn.model_selection.GridSearchCV(estimator, param_grid,
        scoring=None, fit_params=None,
        n_jobs=None,
        refit=True, cv='warn', verbose=0,
        pre_dispatch='2*n_jobs',
        error_score='raise-deprecating',
        return_train_score='warn')
RandomizedSearchCV:
sklearn.model_selection.RandomizedSearchCV(estimator,
        param_distributions, n_iter=10,
        scoring=None, fit_params=None,
        n_jobs=None, refit=True,
        cv='warn', verbose=0,
        pre_dispatch='2*n_jobs',
        random_state=None,
        error_score='raise-deprecating',
        return_train_score='warn')
Key differences
Two key differences:
n_iterwhich is the number of samples for the random search to take from your grid. In the previous example you did 300.param_distributionsis slightly different fromparam_grid, allowing optional ability to set a distribution for sampling.- The default is all combinations have equal chance to be chosen.
Build a RandomizedSearchCV Object
Now we can build a random search object just like the grid search, but with our small change:
# Set up the sample space learn_rate_list = np.linspace(0.001,2,150) min_samples_leaf_list = list(range(1,51)) # Create the grid parameter_grid = { 'learning_rate' : learn_rate_list, 'min_samples_leaf' : min_samples_leaf_list}# Define how many samples number_models = 10
Build a RandomizedSearchCV Object
Now we can build the object
# Create a random search object
random_GBM_class = RandomizedSearchCV(
    estimator = GradientBoostingClassifier(),
    param_distributions = parameter_grid,
    n_iter = number_models,
    scoring='accuracy',
    n_jobs=4,
    cv = 10,
    refit=True,
    return_train_score = True)
# Fit the object to our data
random_GBM_class.fit(X_train, y_train)
Analyze the output
The output is exactly the same!
How do we see what hyperparameter values were chosen?
The cv_results_ dictionary (in the relevant param_ columns)!
Extract the lists:
rand_x = list(random_GBM_class.cv_results_['param_learning_rate'])
rand_y = list(random_GBM_class.cv_results_['param_min_samples_leaf'])
Analyze the output
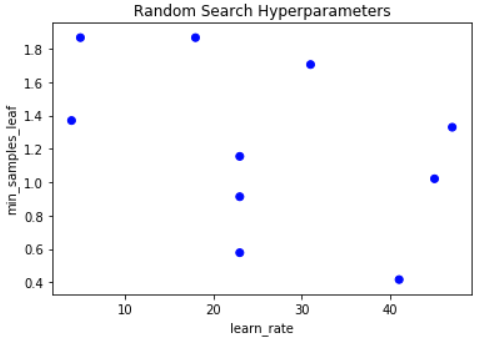
Build our visualization:
# Make sure we set the limits of Y and X appriately x_lims = [np.min(learn_rate_list), np.max(learn_rate_list)] y_lims = [np.min(min_samples_leaf_list), np.max(min_samples_leaf_list)]# Plot grid results plt.scatter(rand_y, rand_x, c=['blue']*10) plt.gca().set(xlabel='learn_rate', ylabel='min_samples_leaf', title='Random Search Hyperparameters') plt.show()
Analyze the output
A similar graph to before:
Let's practice!
Hyperparameter Tuning in Python

