Adding a third variable with hue
Introduction to Data Visualization with Seaborn

Content Team
DataCamp
Tips dataset
import pandas as pd import seaborn as snstips = sns.load_dataset("tips")tips.head()
   total_bill   tip     sex smoker  day    time  size
0       16.99  1.01  Female     No  Sun  Dinner     2
1       10.34  1.66    Male     No  Sun  Dinner     3
2       21.01  3.50    Male     No  Sun  Dinner     3
3       23.68  3.31    Male     No  Sun  Dinner     2
4       24.59  3.61  Female     No  Sun  Dinner     4
1 Waskom, M. L. (2021). seaborn: statistical data visualization. https://seaborn.pydata.org/
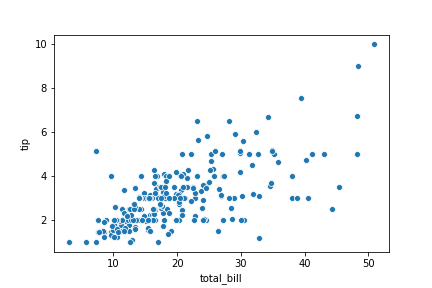
A basic scatter plot
import matplotlib.pyplot as plt
import seaborn as sns

sns.scatterplot(x="total_bill",
                y="tip",
                data=tips)

plt.show()
1 Waskom, M. L. (2021). seaborn: statistical data visualization. https://seaborn.pydata.org/
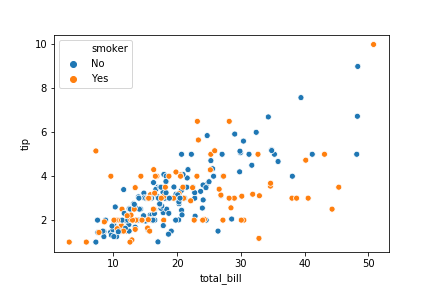
A scatter plot with hue
import matplotlib.pyplot as plt import seaborn as sns sns.scatterplot(x="total_bill", y="tip", data=tips, hue="smoker")plt.show()
1 Waskom, M. L. (2021). seaborn: statistical data visualization. https://seaborn.pydata.org/
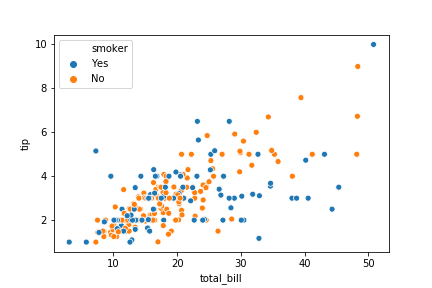
Setting hue order
import matplotlib.pyplot as plt import seaborn as sns sns.scatterplot(x="total_bill", y="tip", data=tips, hue="smoker", hue_order=["Yes", "No"])plt.show()
1 Waskom, M. L. (2021). seaborn: statistical data visualization. https://seaborn.pydata.org/
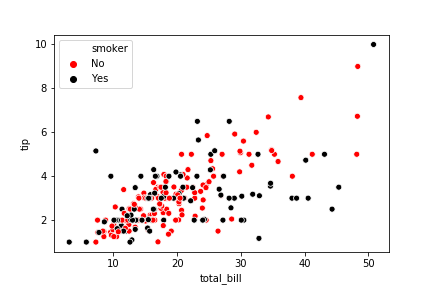
Specifying hue colors
import matplotlib.pyplot as plt import seaborn as snshue_colors = {"Yes": "black", "No": "red"}sns.scatterplot(x="total_bill", y="tip", data=tips, hue="smoker", palette=hue_colors) plt.show()
1 Waskom, M. L. (2021). seaborn: statistical data visualization. https://seaborn.pydata.org/
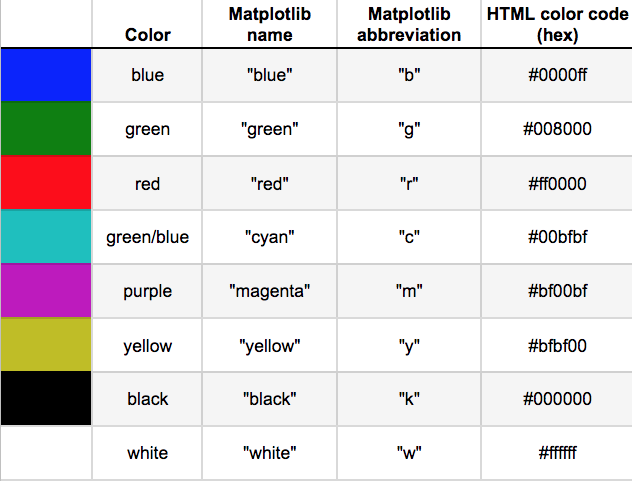
Using HTML hex color codes with hue
import matplotlib.pyplot as plt import seaborn as sns hue_colors = {"Yes": "#808080", "No": "#00FF00"} sns.scatterplot(x="total_bill", y="tip", data=tips, hue="smoker", palette=hue_colors)plt.show()
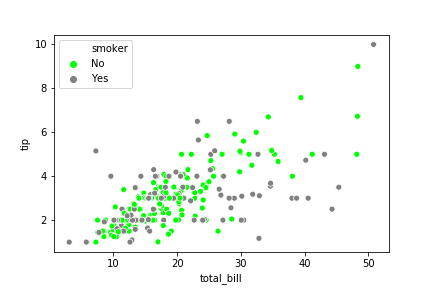
1 Waskom, M. L. (2021). seaborn: statistical data visualization. https://seaborn.pydata.org/
Using hue with count plots
import matplotlib.pyplot as plt import seaborn as sns sns.countplot(x="smoker", data=tips, hue="sex")plt.show()
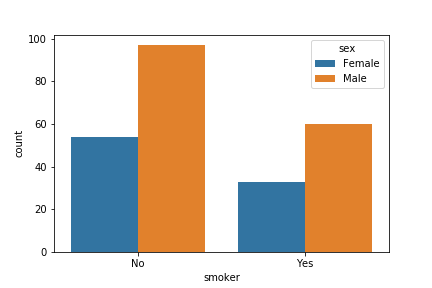
1 Waskom, M. L. (2021). seaborn: statistical data visualization. https://seaborn.pydata.org/
Let's practice!
Introduction to Data Visualization with Seaborn

