Histograms

Analyzing Business Data in SQL

Michel Semaan

Data Scientist

Histograms - overview
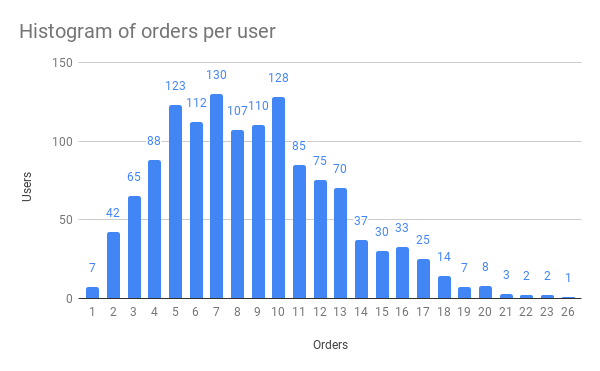
Histogram: Visualizes the frequencies of each value in a dataset

Frequency table

orders  users
------  -----
1       7
2       42
3       65
...     ...

Histogram of orders per user

Analyzing Business Data in SQL

Histograms - query (I)

WITH user_orders AS (
  SELECT
    user_id,
    COUNT(DISTINCT order_id) AS orders
  FROM meals
  JOIN orders ON meals.meal_id = orders.meal_id
  GROUP BY user_id)

SELECT orders, COUNT(DISTINCT user_id) AS users FROM user_orders GROUP BY orders ORDER BY orders ASC;
Analyzing Business Data in SQL

Histograms - query (II)

WITH user_revenues AS (
  SELECT
    user_id,
    SUM(meal_price * order_quantity) AS revenue
  FROM meals
  JOIN orders ON meals.meal_id = orders.meal_id
  GROUP BY user_id)

SELECT ROUND(revenue :: NUMERIC, -2) AS revenue_100, COUNT(DISTINCT user_id) AS users FROM user_revenues GROUP BY revenue_100 ORDER BY revenue_100 ASC;
Analyzing Business Data in SQL

Plotting histograms

Microsoft Excel

Google Sheets

matplotlib

ggplot2

Analyzing Business Data in SQL

What do histograms tell you?

U-shaped histogram

U-shaped histogram

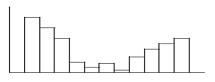
  • Many users who generate low and high levels of revenue; few who generate median level of revenue

Normal histogram

Normal histogram

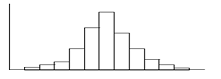
  • Many users who generate median level of revenue; few who generate low or high levels of revenue
Analyzing Business Data in SQL

Histograms

Analyzing Business Data in SQL

Preparing Video For Download...