Plotting a regression model

Generalized Linear Models in Python

Ita Cirovic Donev

Data Science Consultant

Import libraries

import seaborn as sns
import matplotlib.pyplot as plt
  • Crab model 'sat ~ width' is saved as model
Generalized Linear Models in Python

Plot data points

# Adjust figure size
plt.subplots(figsize = (8, 5))
# Plot data points
sns.regplot('width', 'sat', 
            data = crab,
            fit_reg = False)
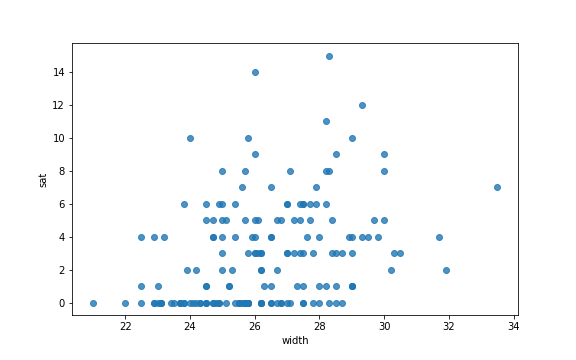
Scatterplot of width and number of satellites from the crab dataset.

Generalized Linear Models in Python

Add jitter

sns.regplot('width', 'sat', 
            data = crab,
            fit_reg = False,
            y_jitter = 0.3)
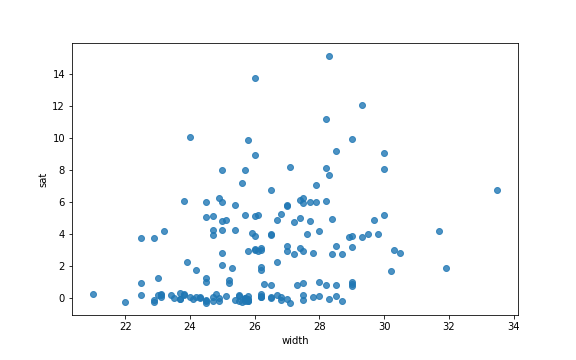
Scatterplot with added jitter of width and number of satellites from the crab dataset.

Generalized Linear Models in Python

Add linear fit

sns.regplot('width', 'sat', 
            data = crab,
            y_jitter = 0.3,
            fit_reg = True,
            line_kws = {'color':'green', 
                        'label':'LM fit'})
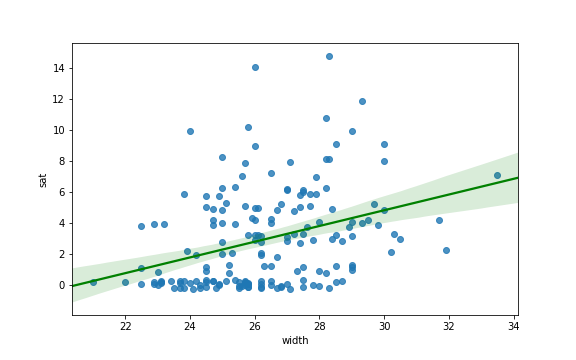
Linear fit with confidence intervals and the scatterplot of width and number of satellites from the crab dataset.

Generalized Linear Models in Python

Add Poisson GLM estimated values

crab['fit_values'] = model.fittedvalues
sns.scatterplot('width','fit_values', 
                data = crab,
                color = 'red', 
                label = 'Poisson')
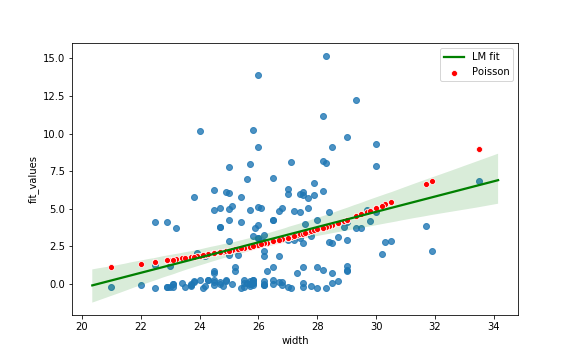
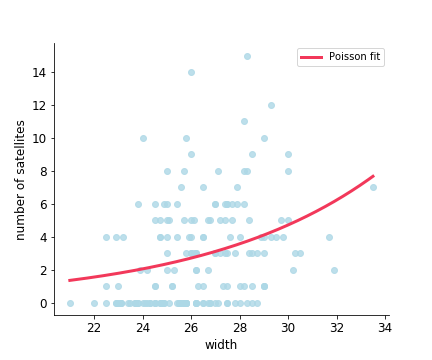
Linear and Poisson fit and the scatterplot of width and number of satellites from the crab dataset.

Generalized Linear Models in Python

Predictions

Poisson model fit overlaid on the scatterplot of width and number of satellites

Generalized Linear Models in Python

Predictions

new_data = pd.DataFrame({'width':[24, 28, 32]})
model.predict(new_data)
0    1.881981
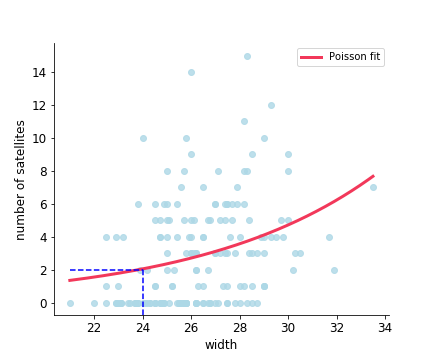
Reading off predicted values of the values of width at 24cm given fitted Poisson regression model.

Generalized Linear Models in Python

Predictions

new_data = pd.DataFrame({'width':[24, 28, 32]})
model.predict(new_data)
0    1.881981
1    3.627360
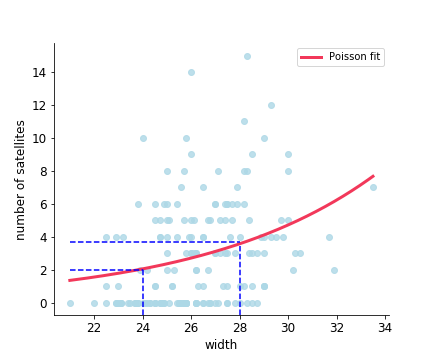
Reading off predicted values of the values of width at 28cm given fitted Poisson regression model.

Generalized Linear Models in Python

Predictions

new_data = pd.DataFrame({'width':[24, 28, 32]})
model.predict(new_data)
0    1.881981
1    3.627360
2    6.991433
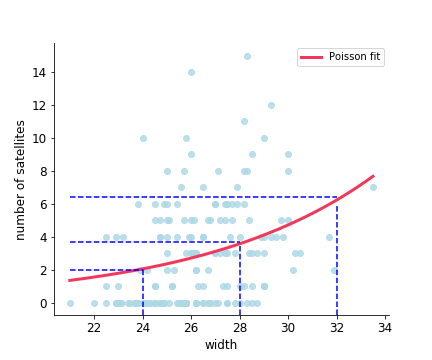
Reading off predicted values of the values of width at 32cm given fitted Poisson regression model.

Generalized Linear Models in Python

Let's practice!

Generalized Linear Models in Python

Preparing Video For Download...