Model formula
Generalized Linear Models in Python

Ita Cirovic Donev
Data Science Consultant
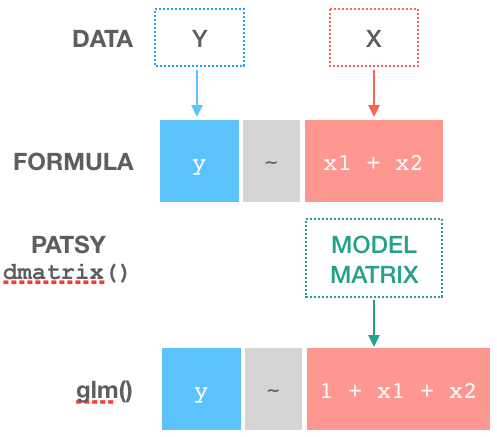
Formula and model matrix

Formula and model matrix
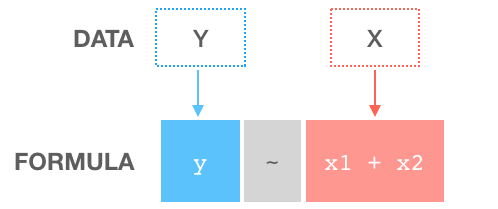
Formula and model matrix
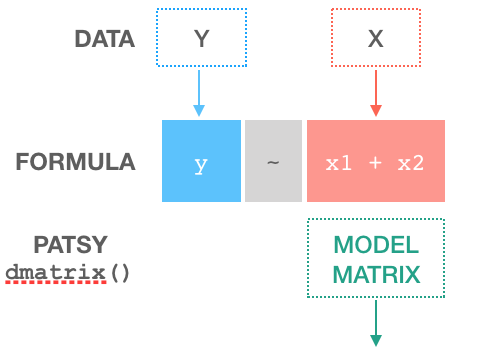
Formula and model matrix
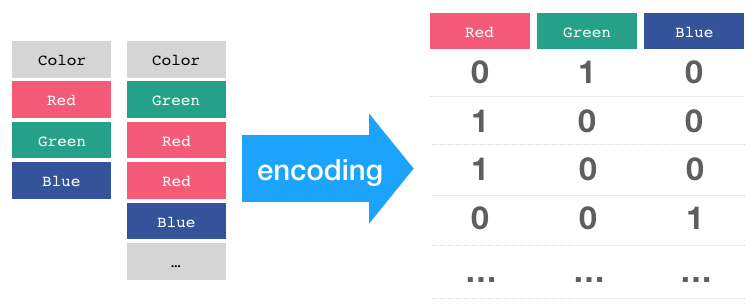
Coding the categorical data

Coding the categorical data

Coding the categorical data