Percentiles, outliers, and box plots
Statistical Thinking in Python (Part 1)

Justin Bois
Teaching Professor at the California Institute of Technology
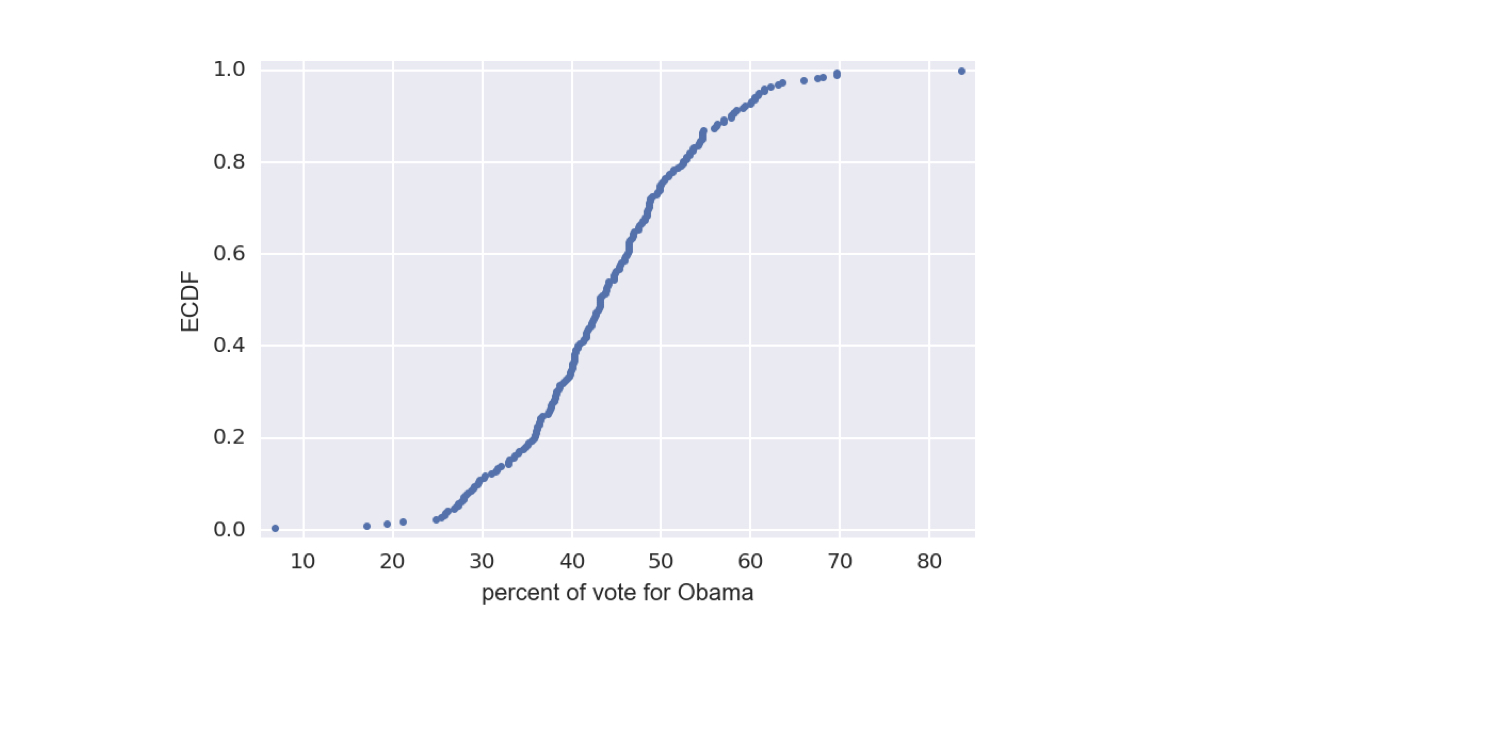
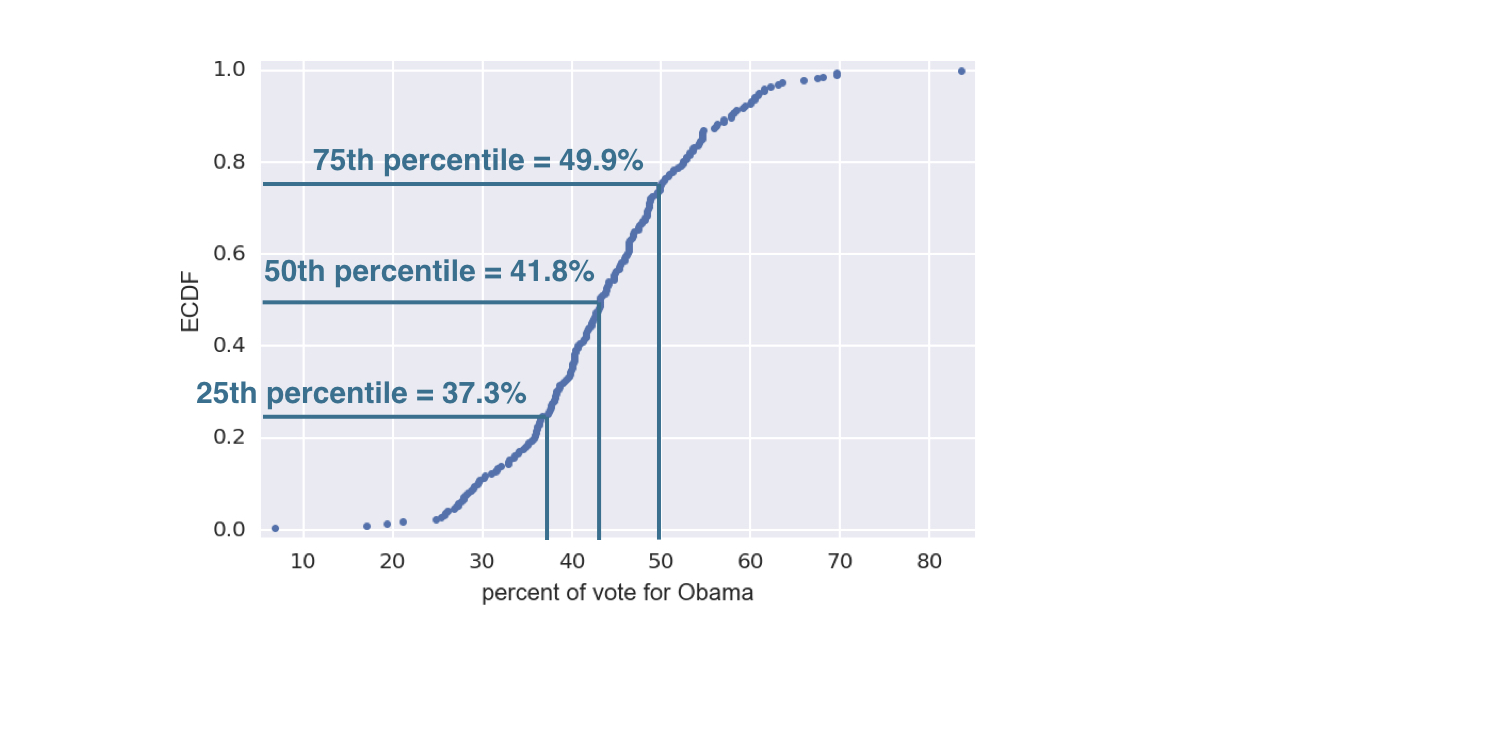
Percentiles on an ECDF
1 Data retrieved from Data.gov (https://www.data.gov/)
Percentiles on an ECDF
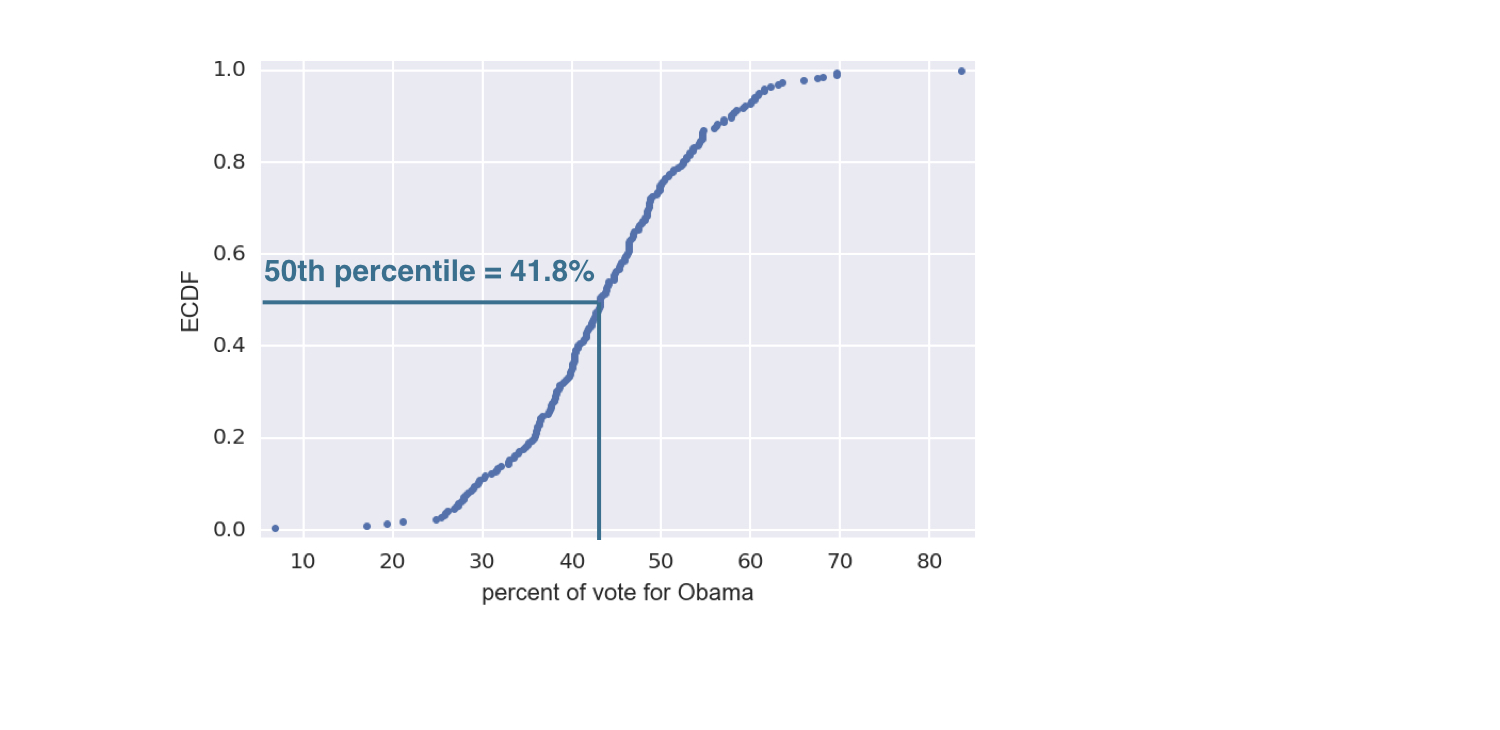
Percentiles on an ECDF
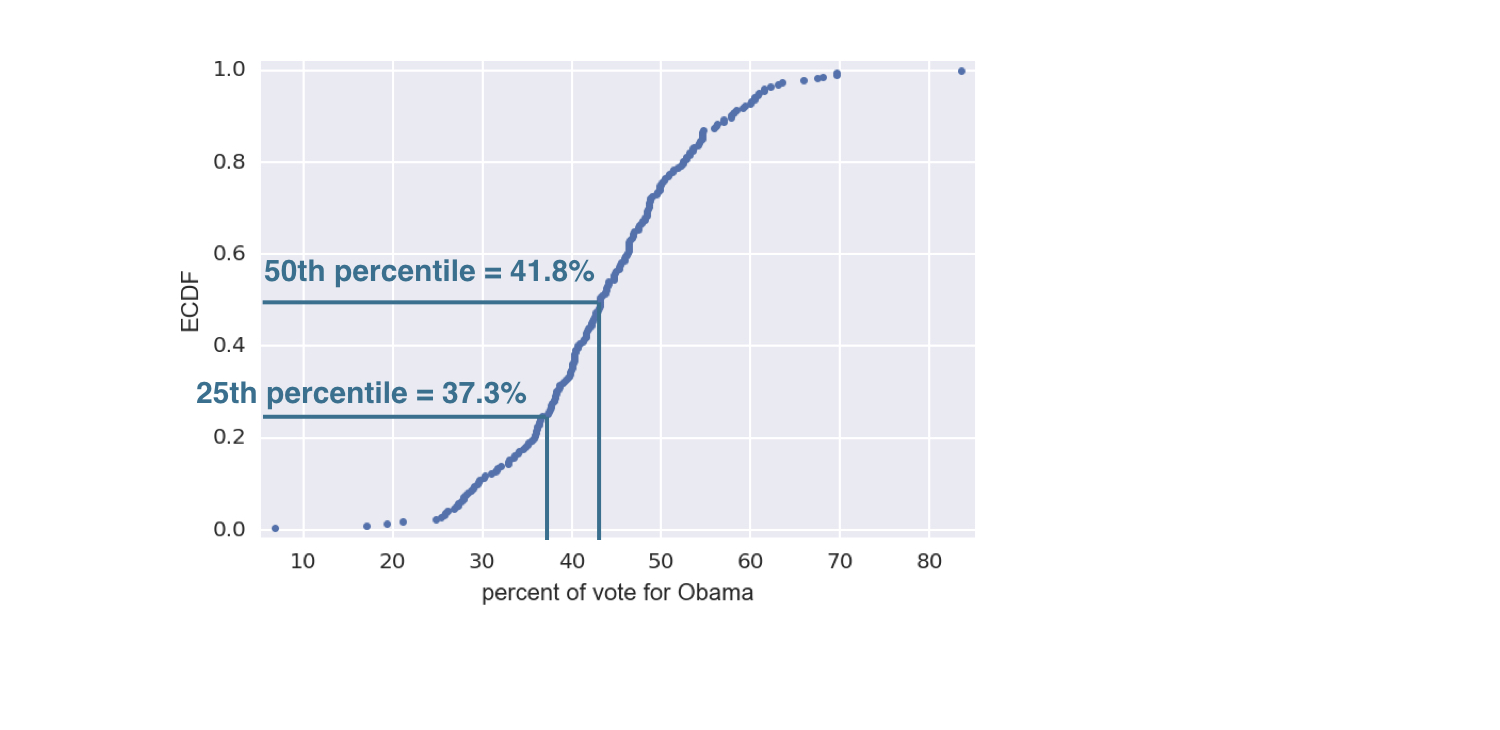
Percentiles on an ECDF
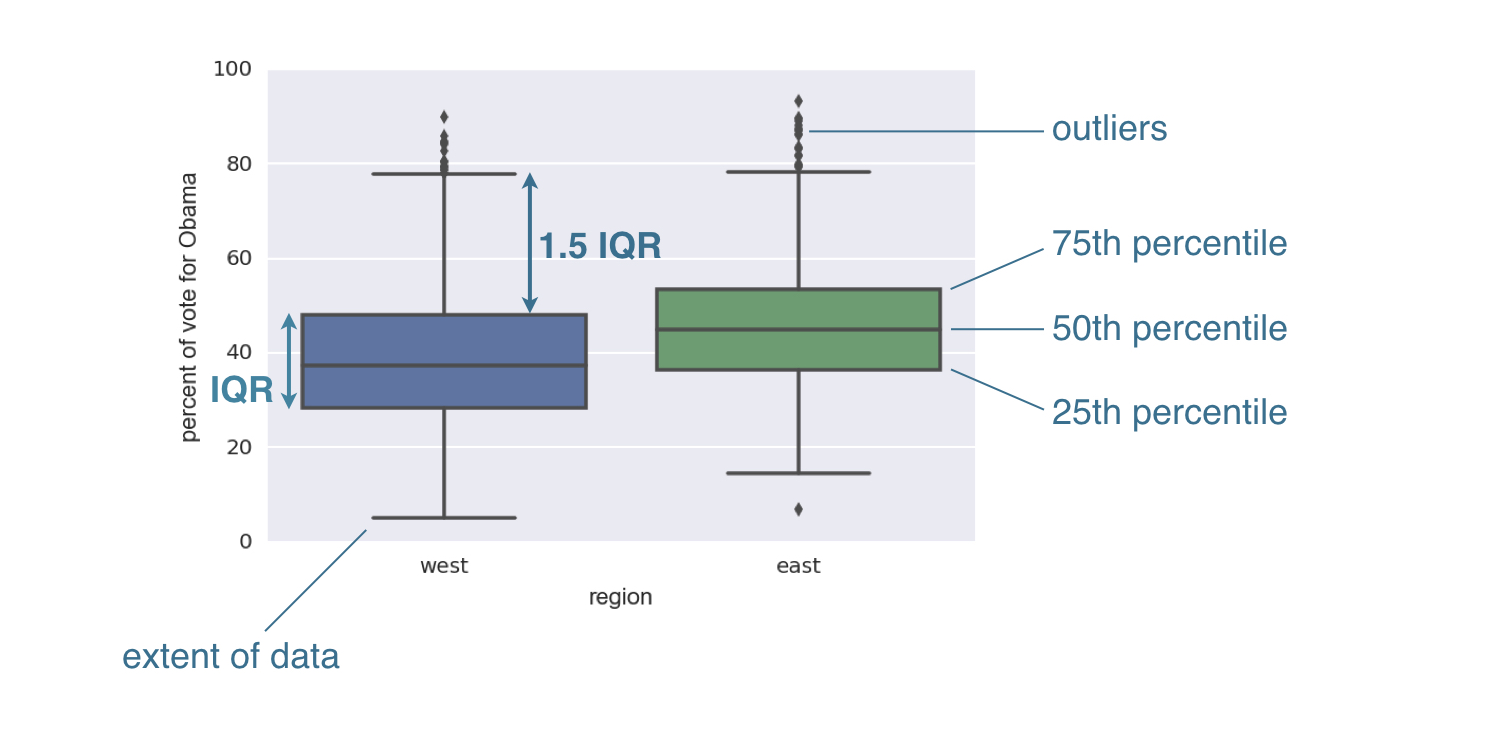
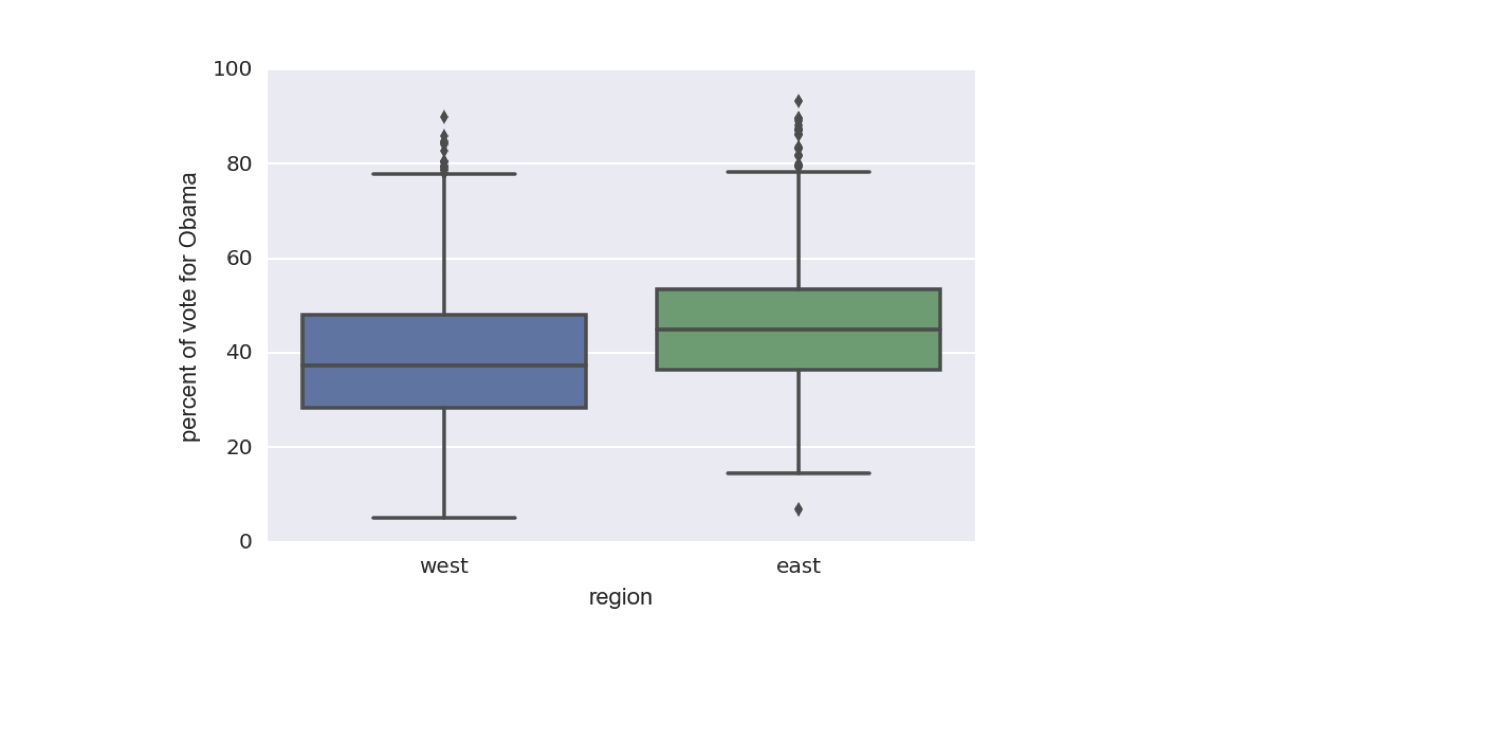
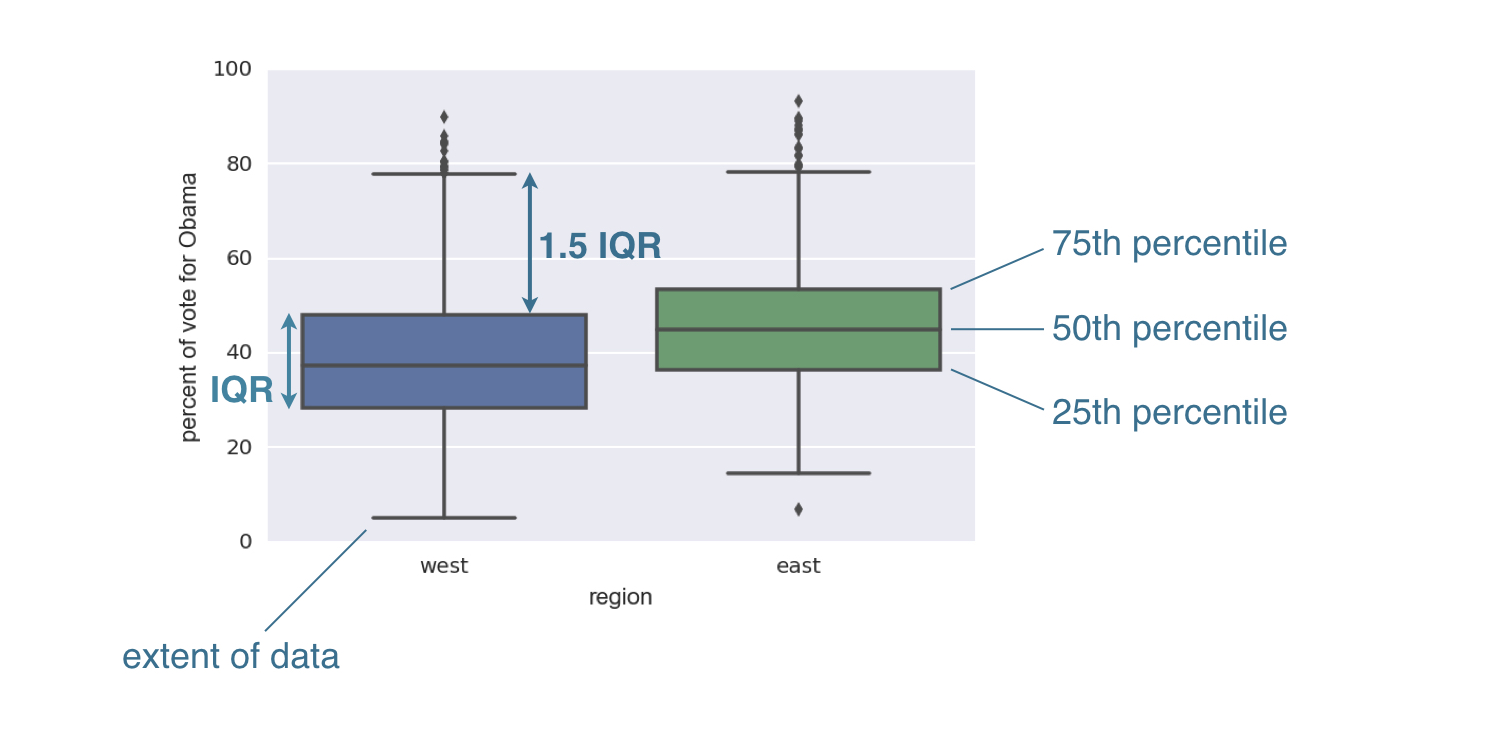
2008 US election box plot
1 Data retrieved from Data.gov (https://www.data.gov/)
2008 US election box plot
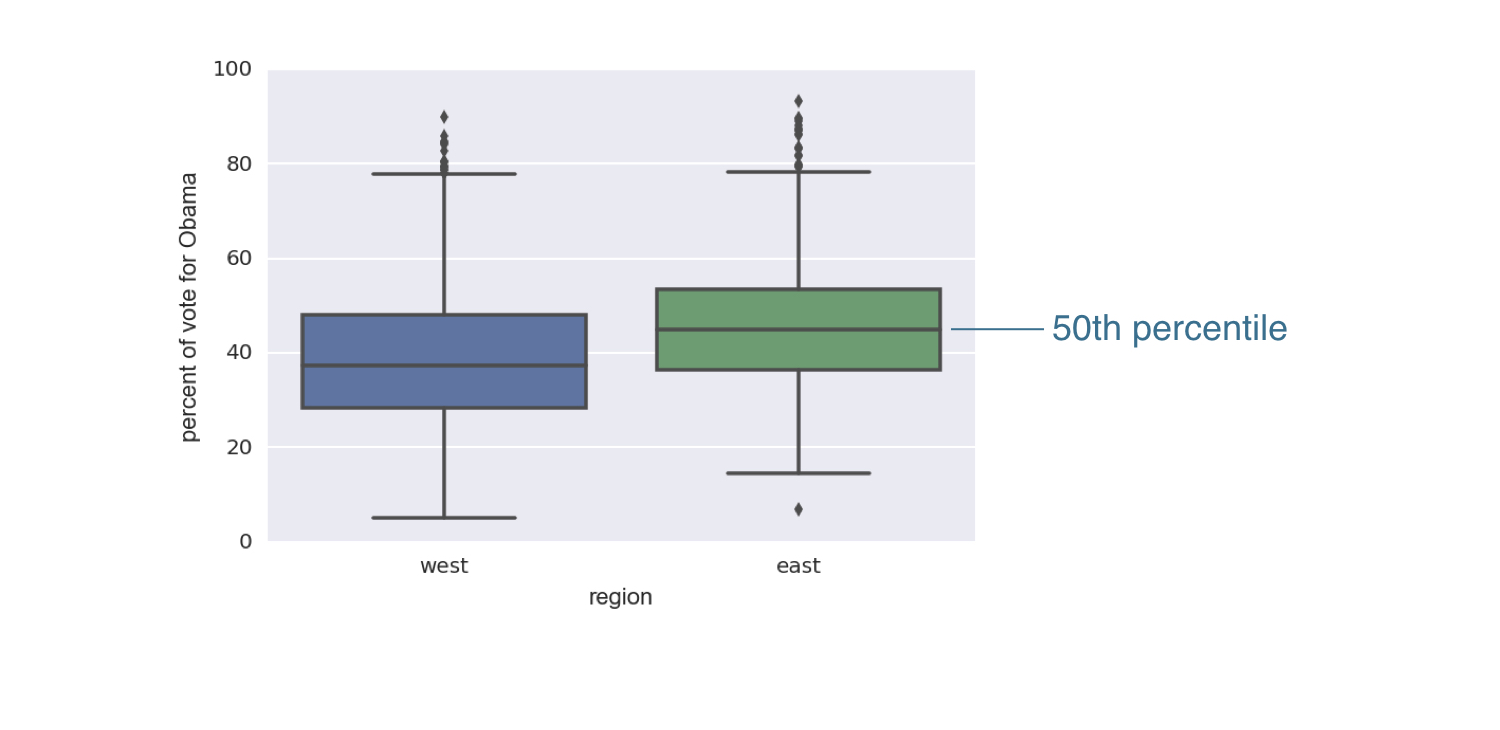
2008 US election box plot

2008 US election box plot
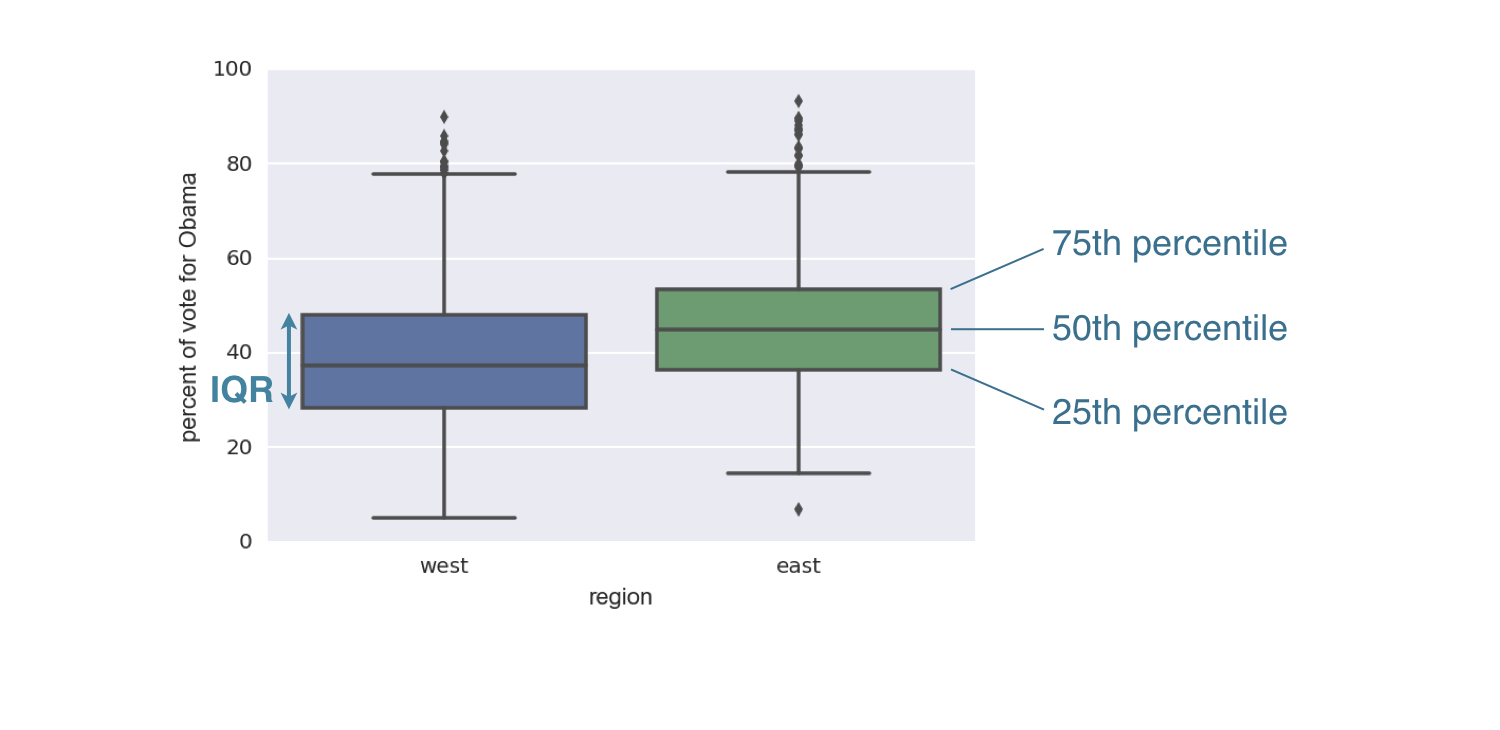
2008 US election box plot
2008 US election box plot