Introduction to the Normal distribution
Statistical Thinking in Python (Part 1)

Justin Bois
Teaching Professor at the California Institute of Technology
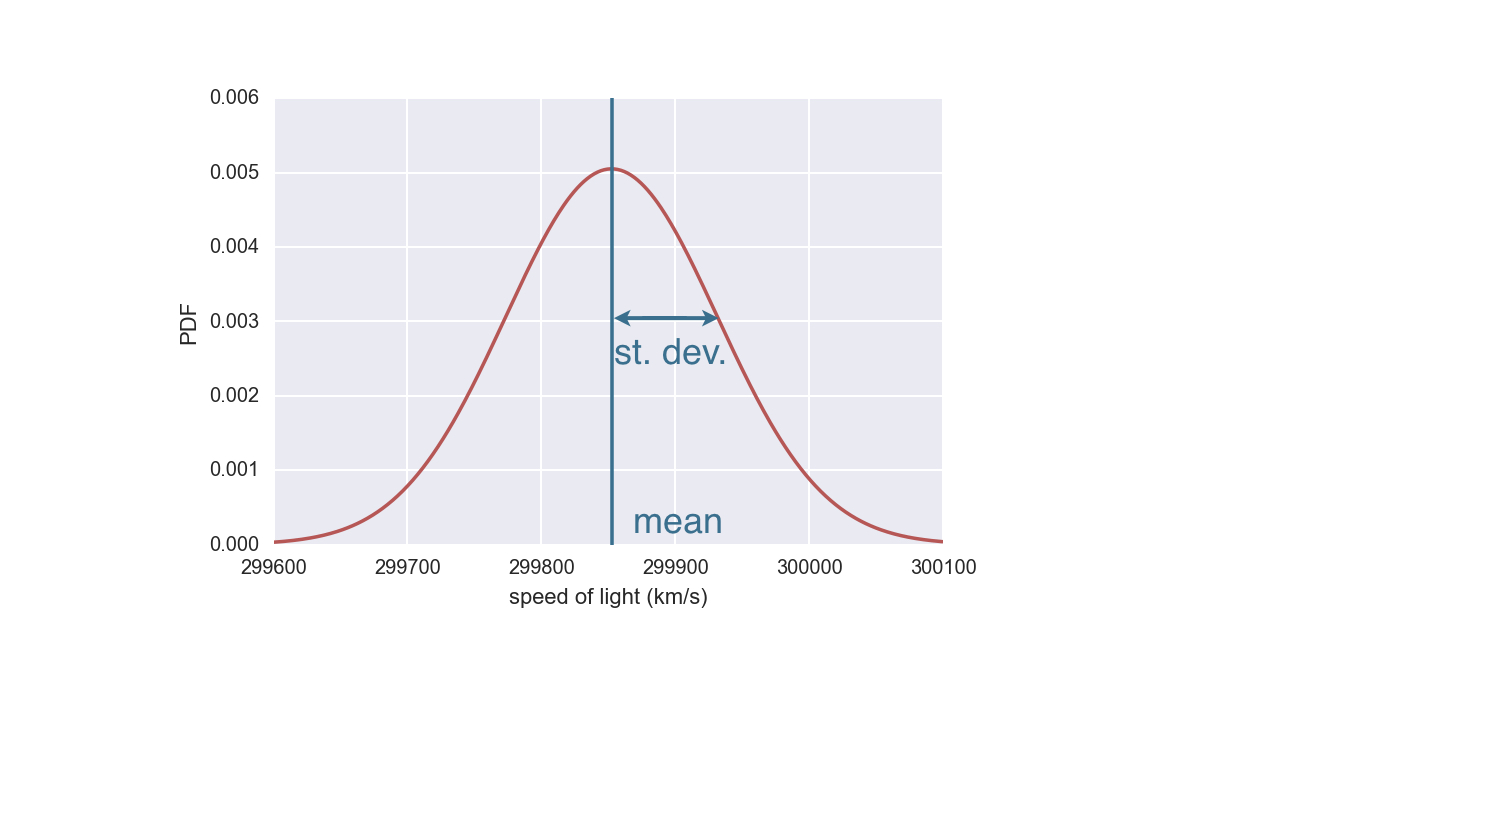
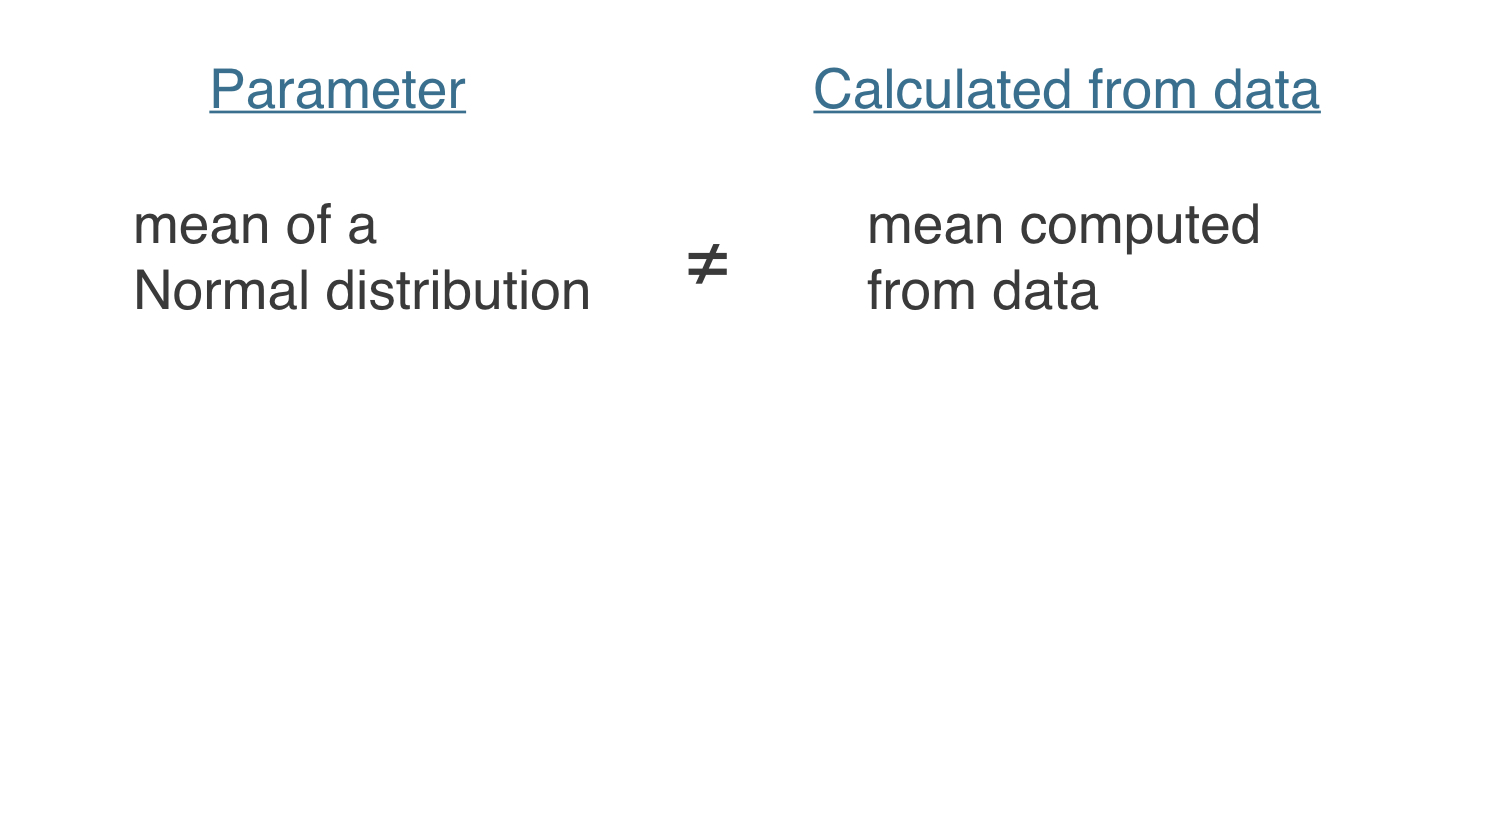
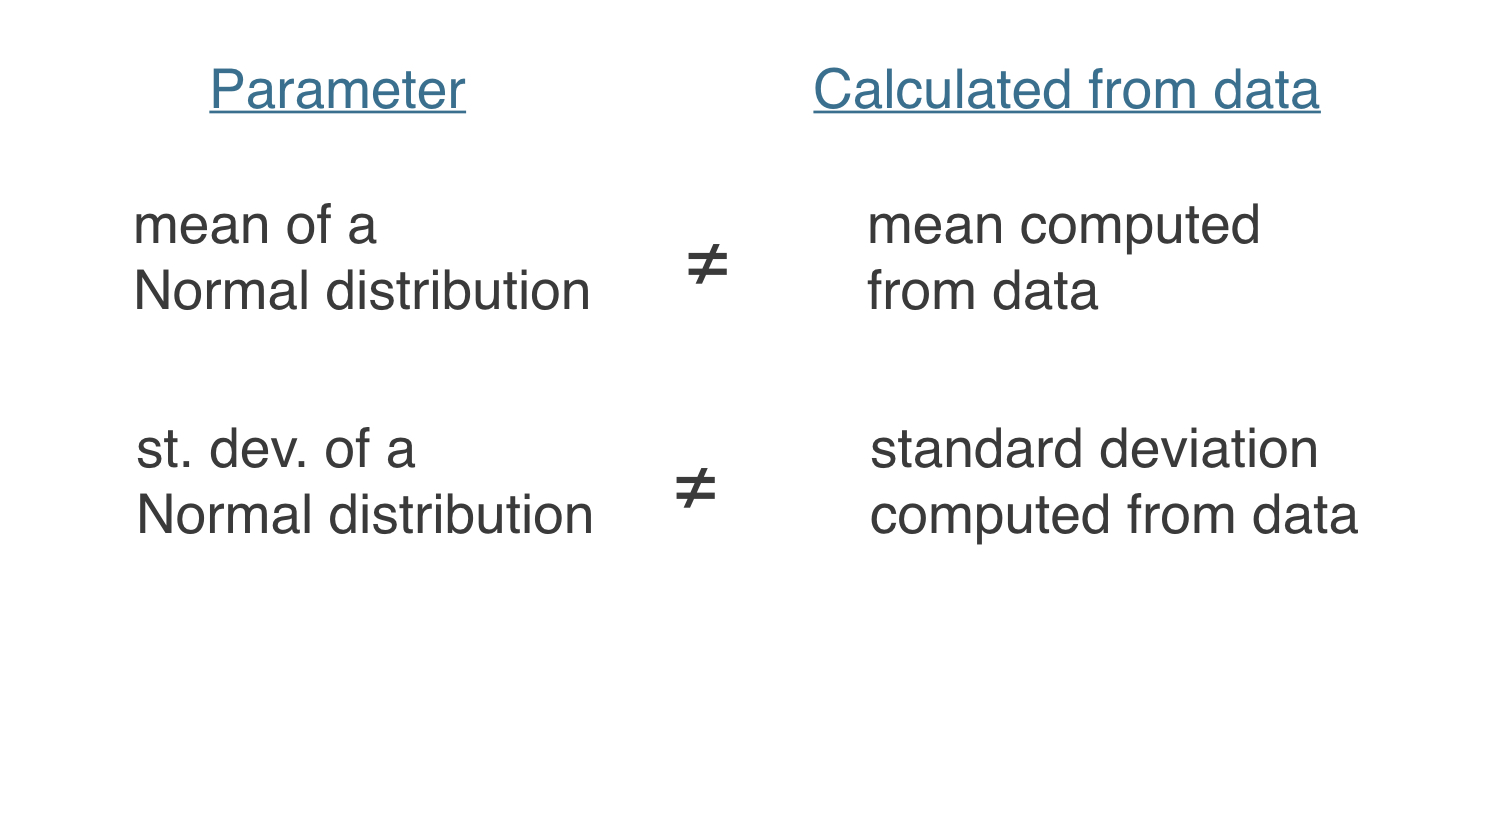
Normal distribution
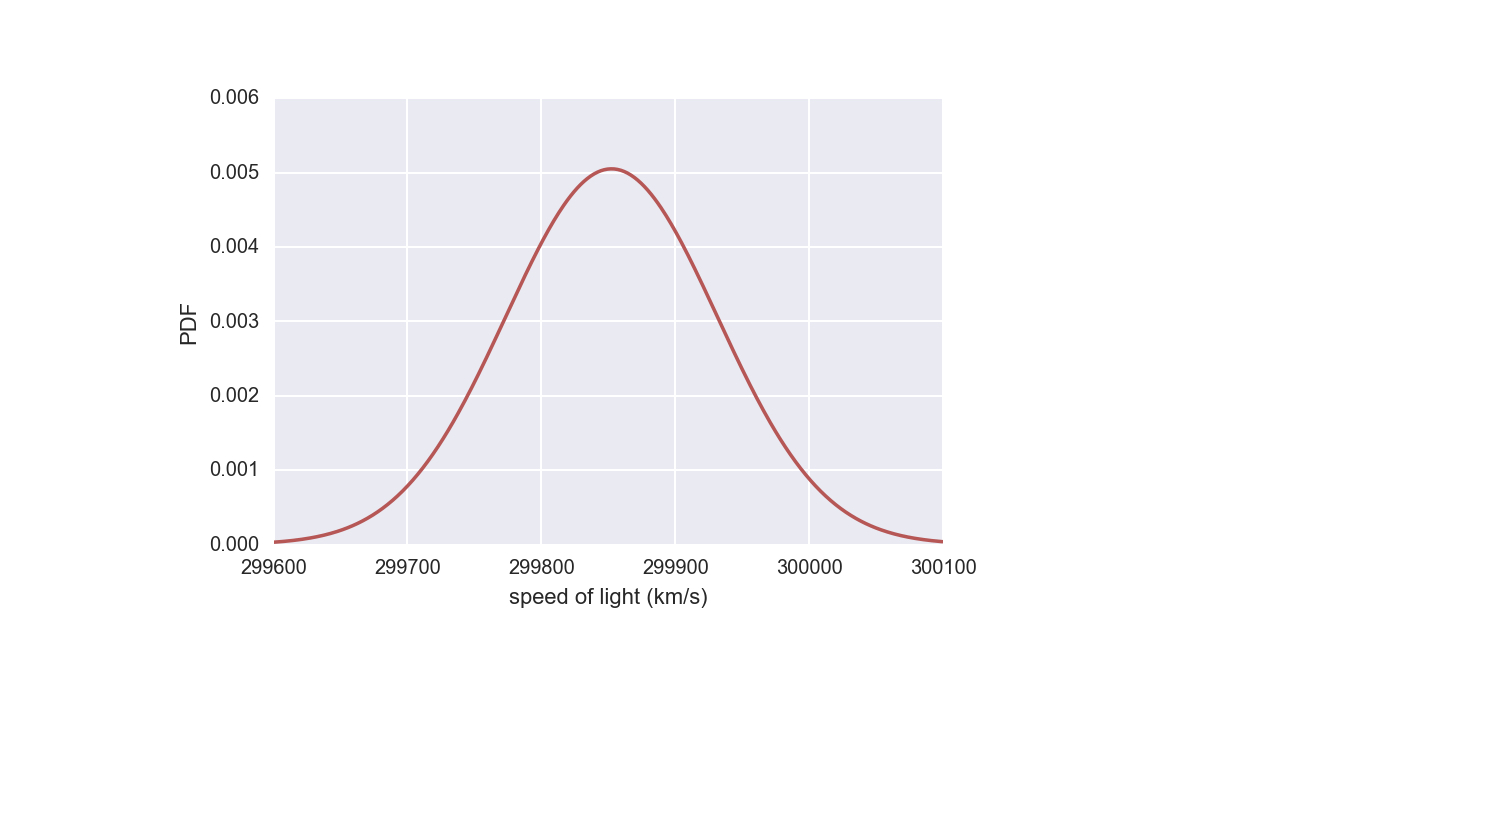
Normal distribution
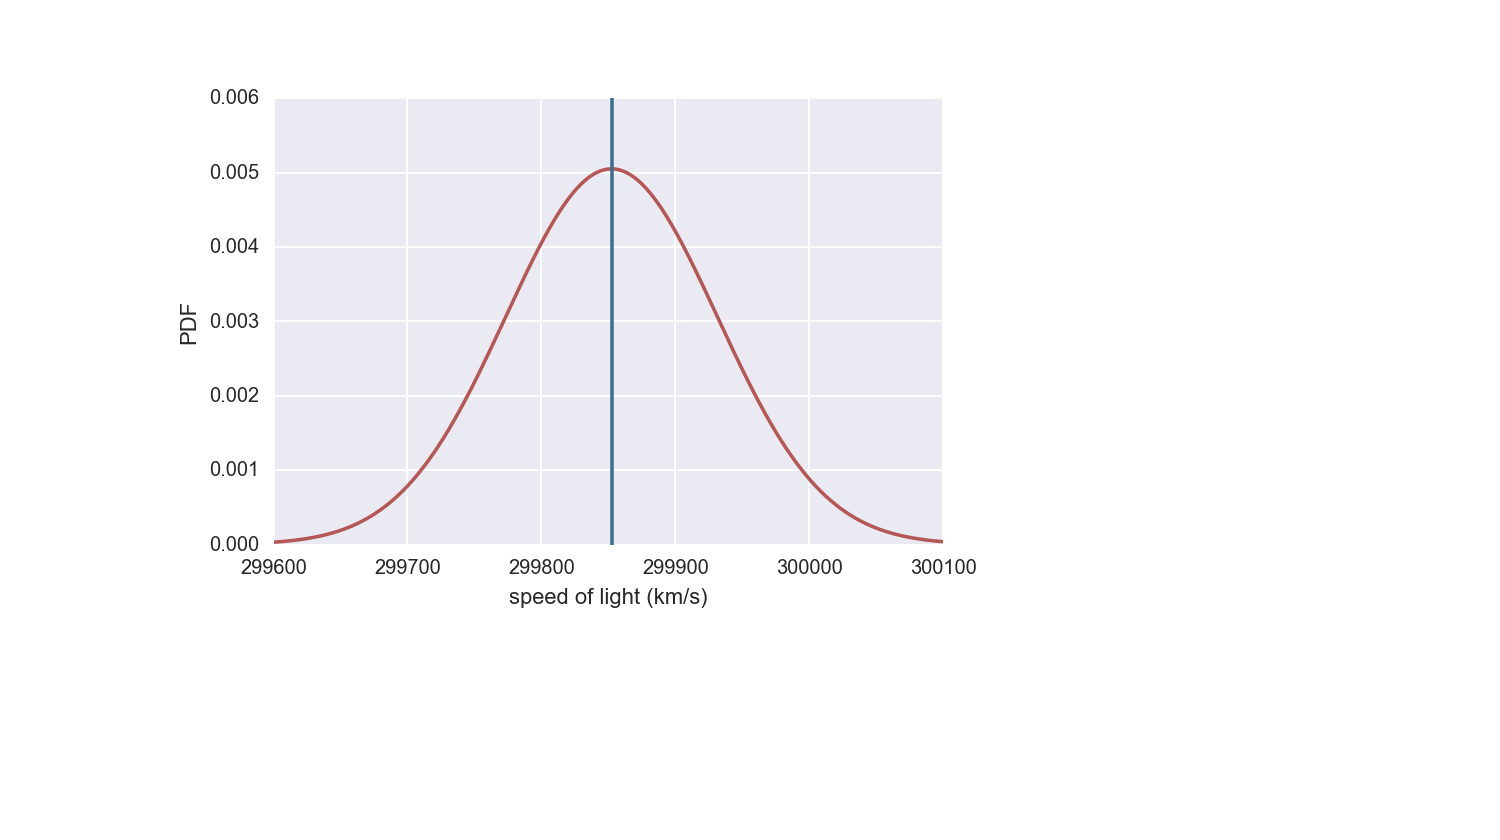
Normal distribution
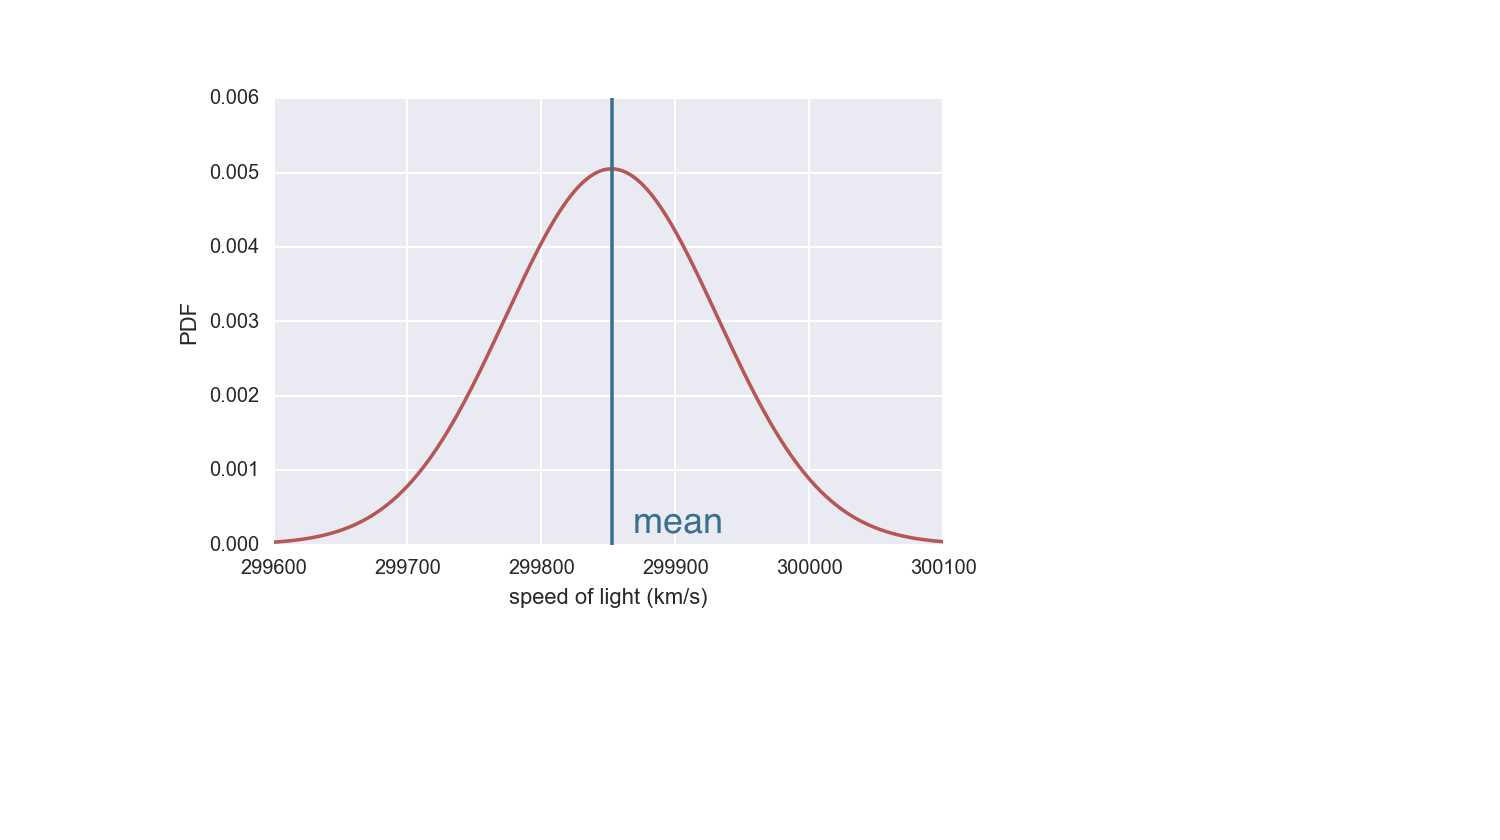
Normal distribution
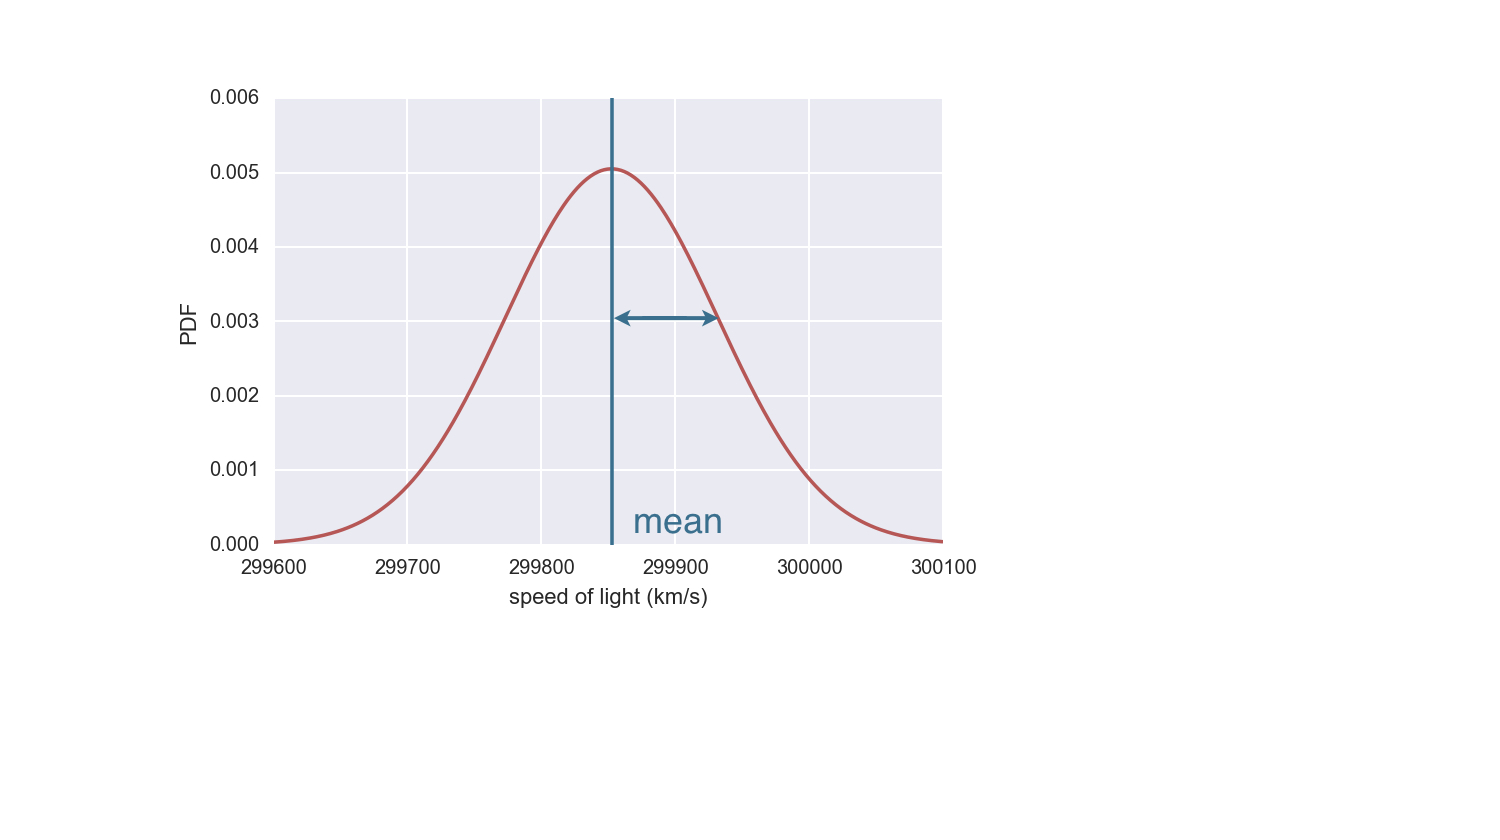
Normal distribution
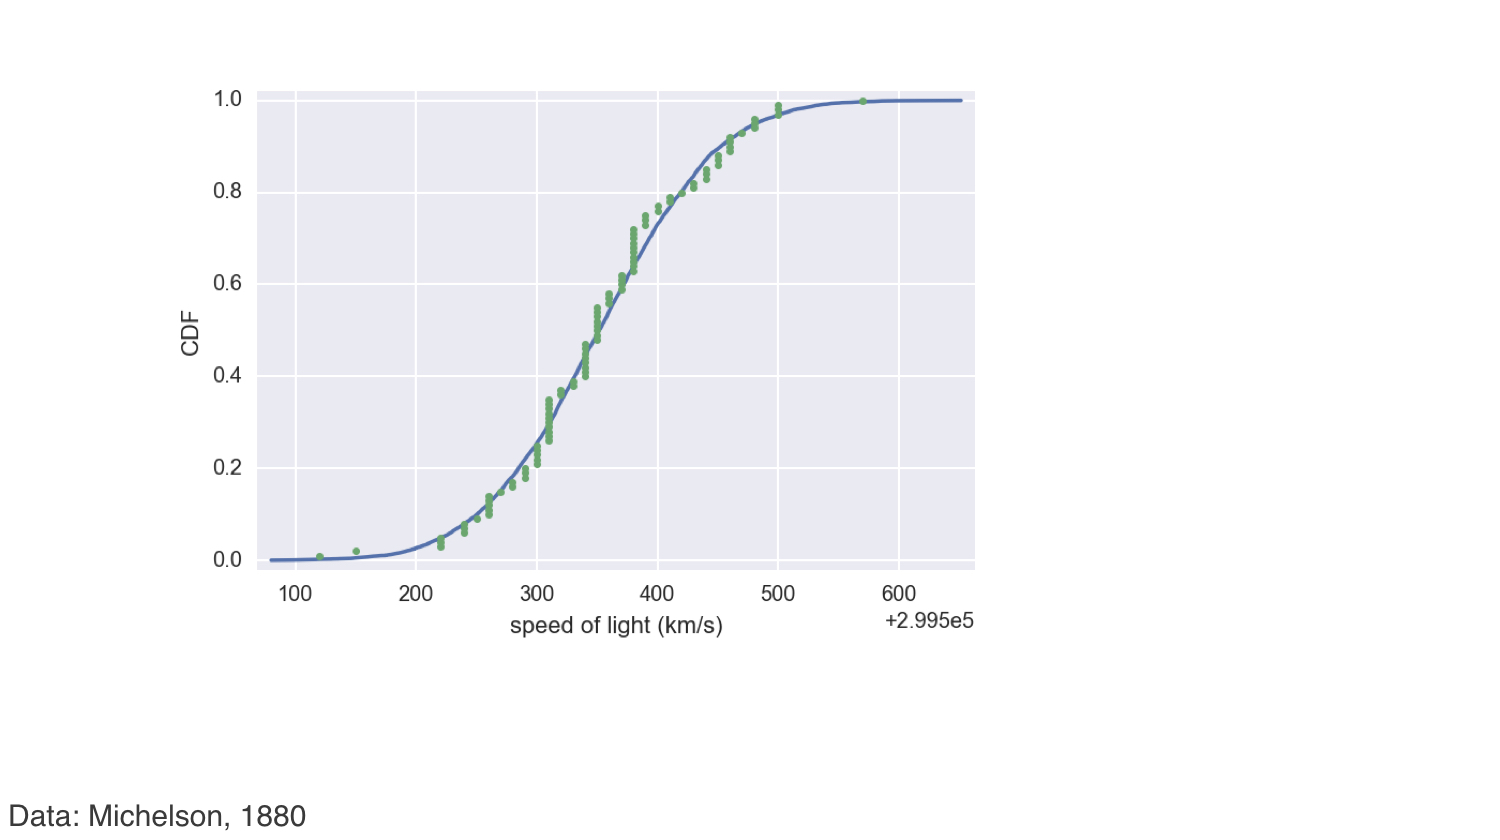
Comparing data to a Normal PDF
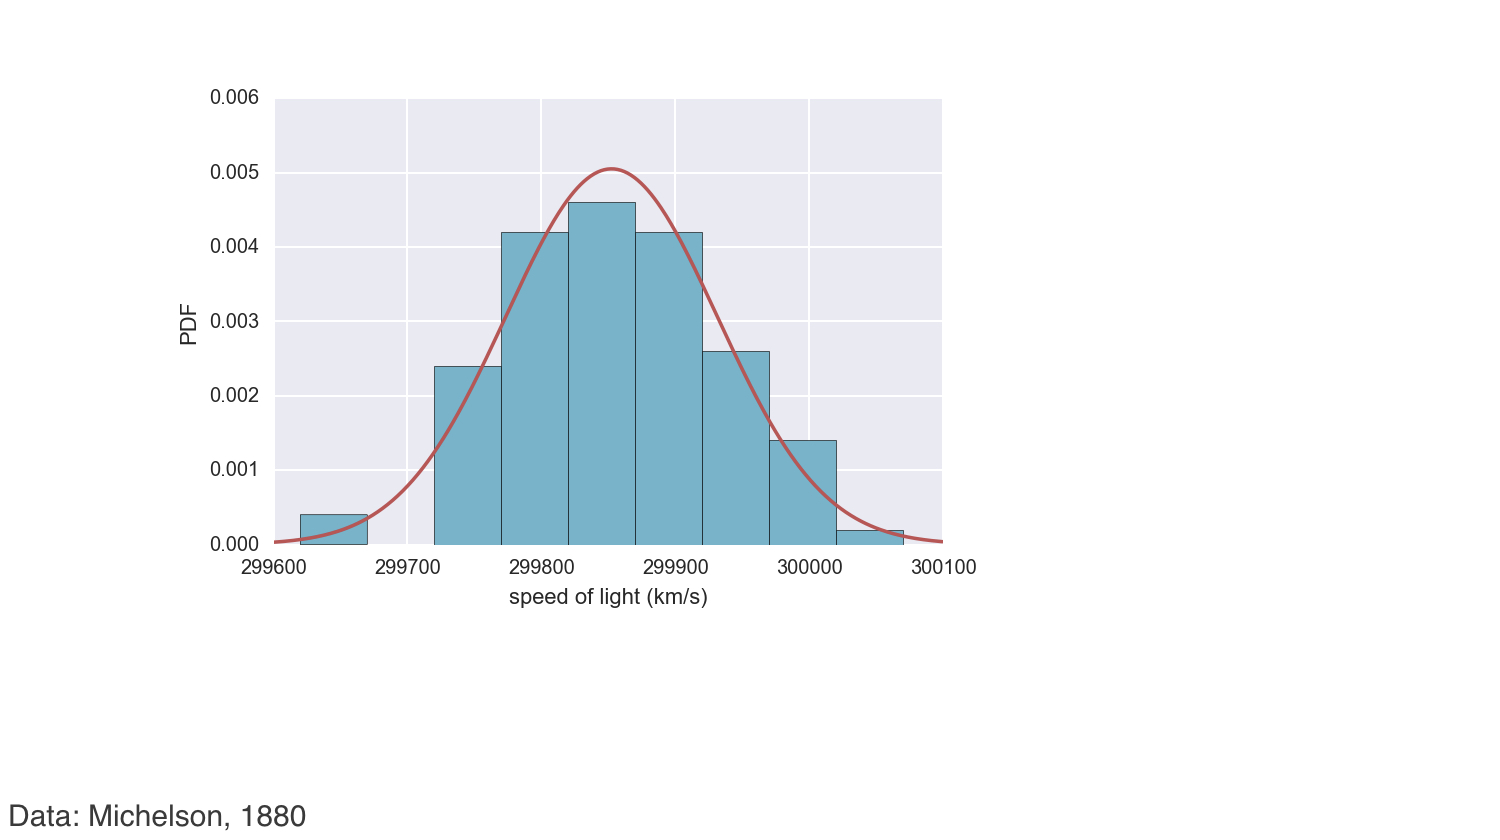
Checking Normality of Michelson data