Introduction to Exploratory Data Analysis
Statistical Thinking in Python (Part 1)

Justin Bois
Teaching Professor at the California Institute of Technology
Exploratory data analysis
- The process of organizing, plotting, and summarizing a data set
“Exploratory data analysis can never be the whole story, but nothing else can serve as the foundation stone.” —John Tukey
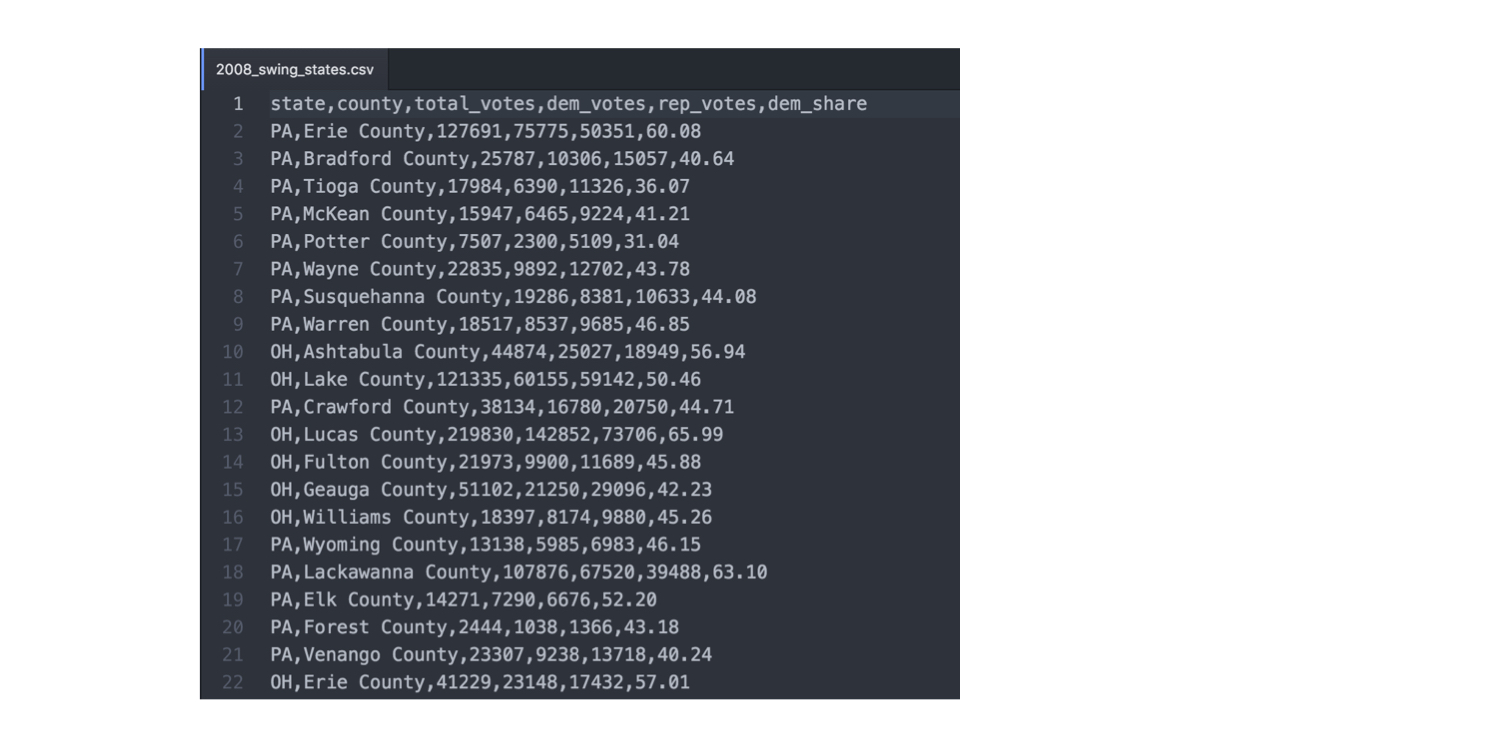
2008 US swing state election results

1 Data retrieved from Data.gov (https://www.data.gov/)
2008 US swing state election results
import pandas as pd
df_swing = pd.read_csv('2008_swing_states.csv')
df_swing[['state', 'county', 'dem_share']]
    state              county  dem_share
0      PA         Erie County      60.08
1      PA     Bradford County      40.64
2      PA        Tioga County      36.07
3      PA       McKean County      41.21
4      PA       Potter County      31.04
5      PA        Wayne County      43.78
6      PA  Susquehanna County      44.08
7      PA       Warren County      46.85
8      OH    Ashtabula County      56.94
1 Data retrieved from Data.gov (https://www.data.gov/)
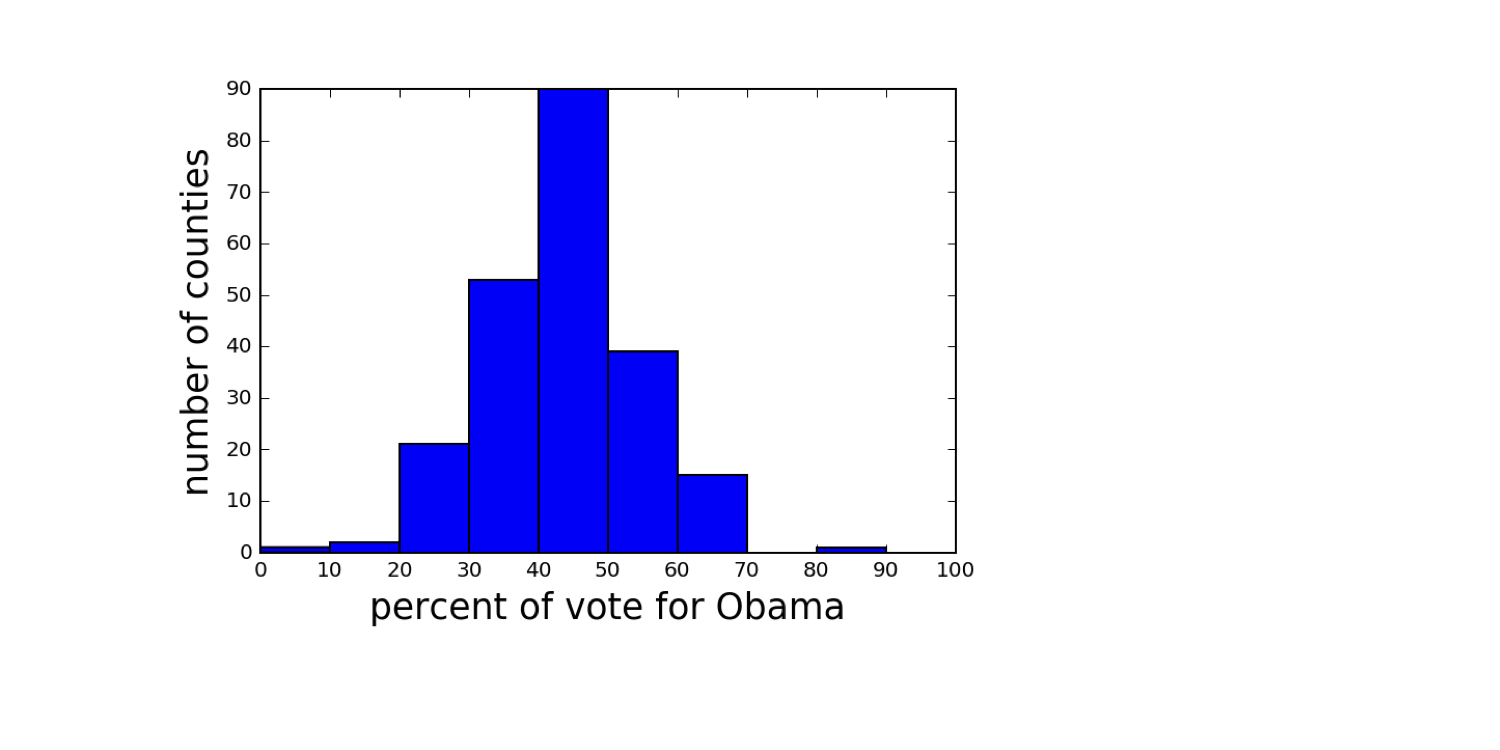
2008 US swing state election results

1 Data retrieved from Data.gov (https://www.data.gov/)
Let's practice!
Statistical Thinking in Python (Part 1)

