Poisson processes and the Poisson distribution
Statistical Thinking in Python (Part 1)

Justin Bois
Teaching Professor at the California Institute of Technology
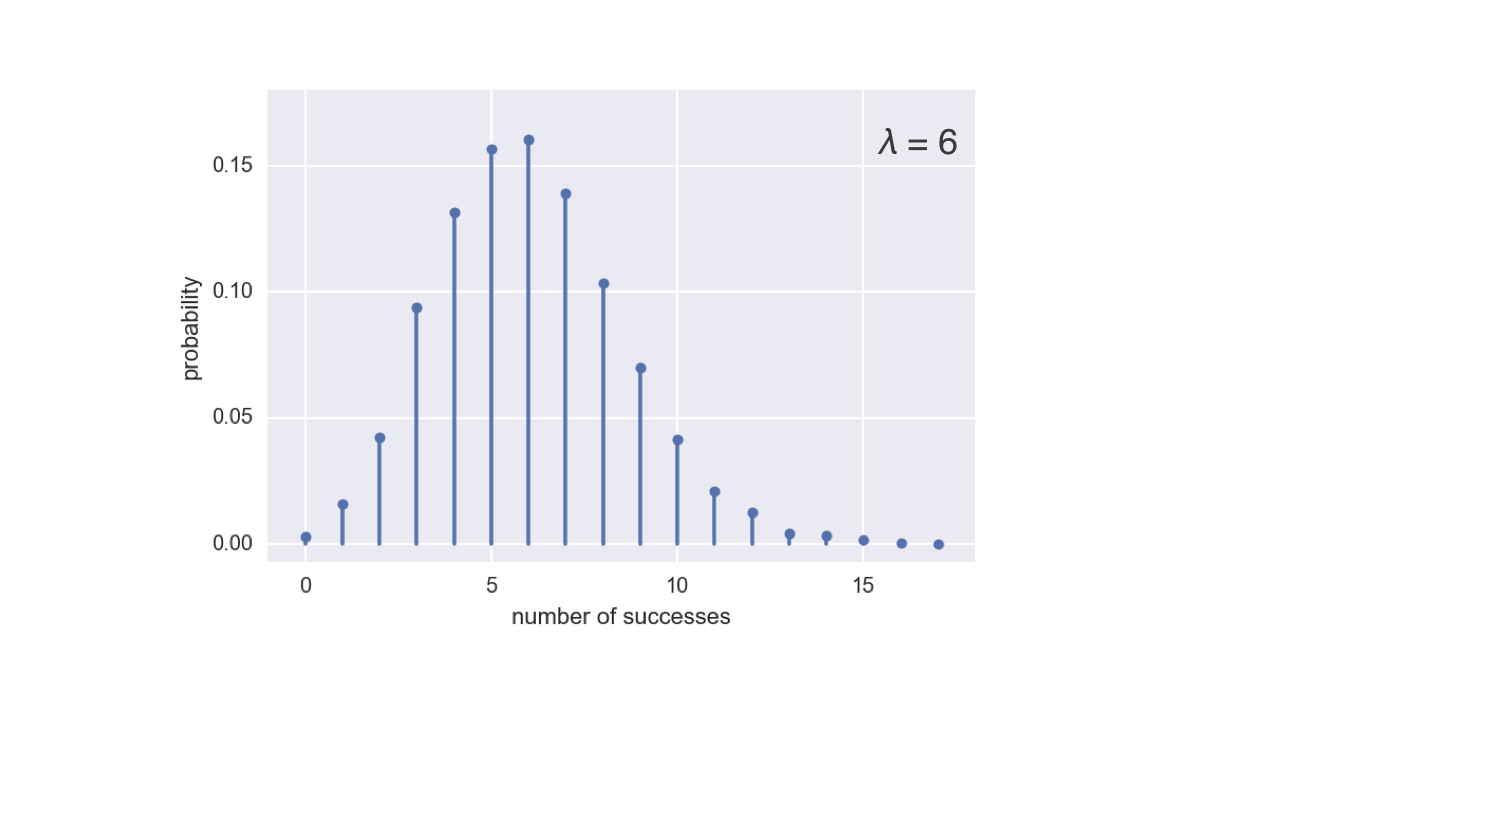
Poisson PMF
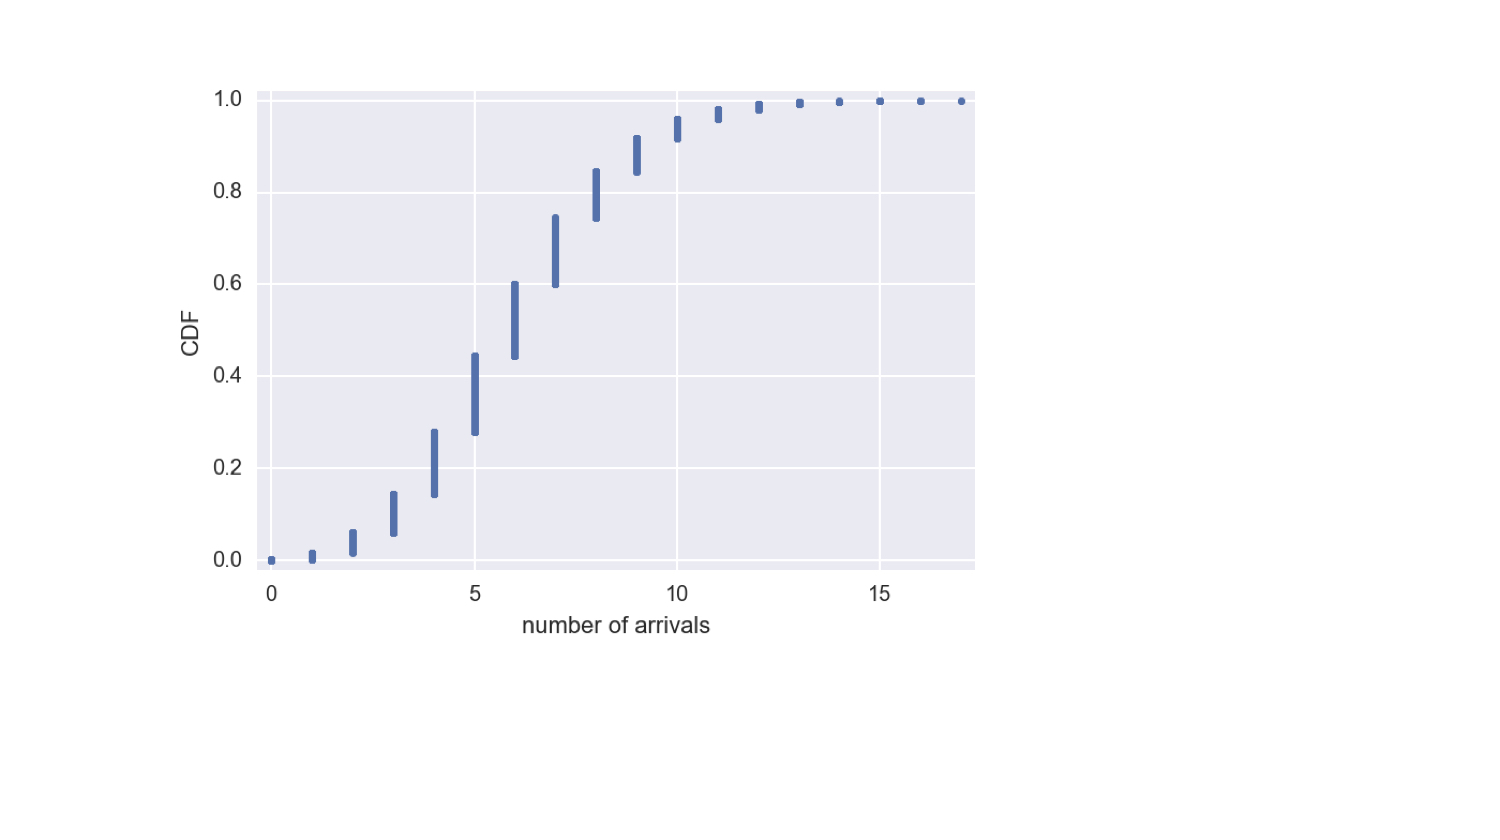
The Poisson CDF
Statistical Thinking in Python (Part 1)
Justin Bois
Teaching Professor at the California Institute of Technology

