Plot all of your data: ECDFs
Statistical Thinking in Python (Part 1)

Justin Bois
Teaching Professor at the California Institute of Technology
2008 US swing state election results
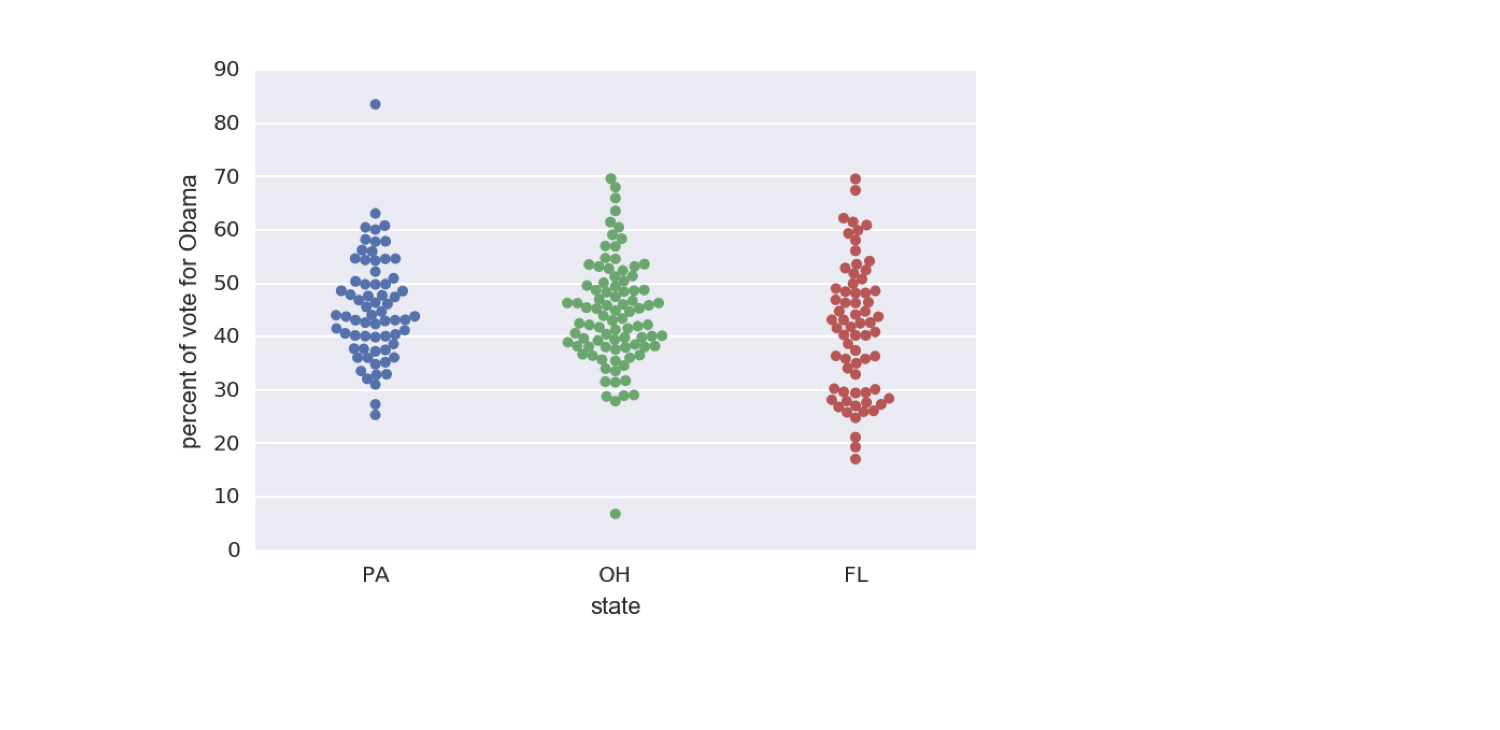
1 Data retrieved from Data.gov (https://www.data.gov/)
2008 US election results: East and West
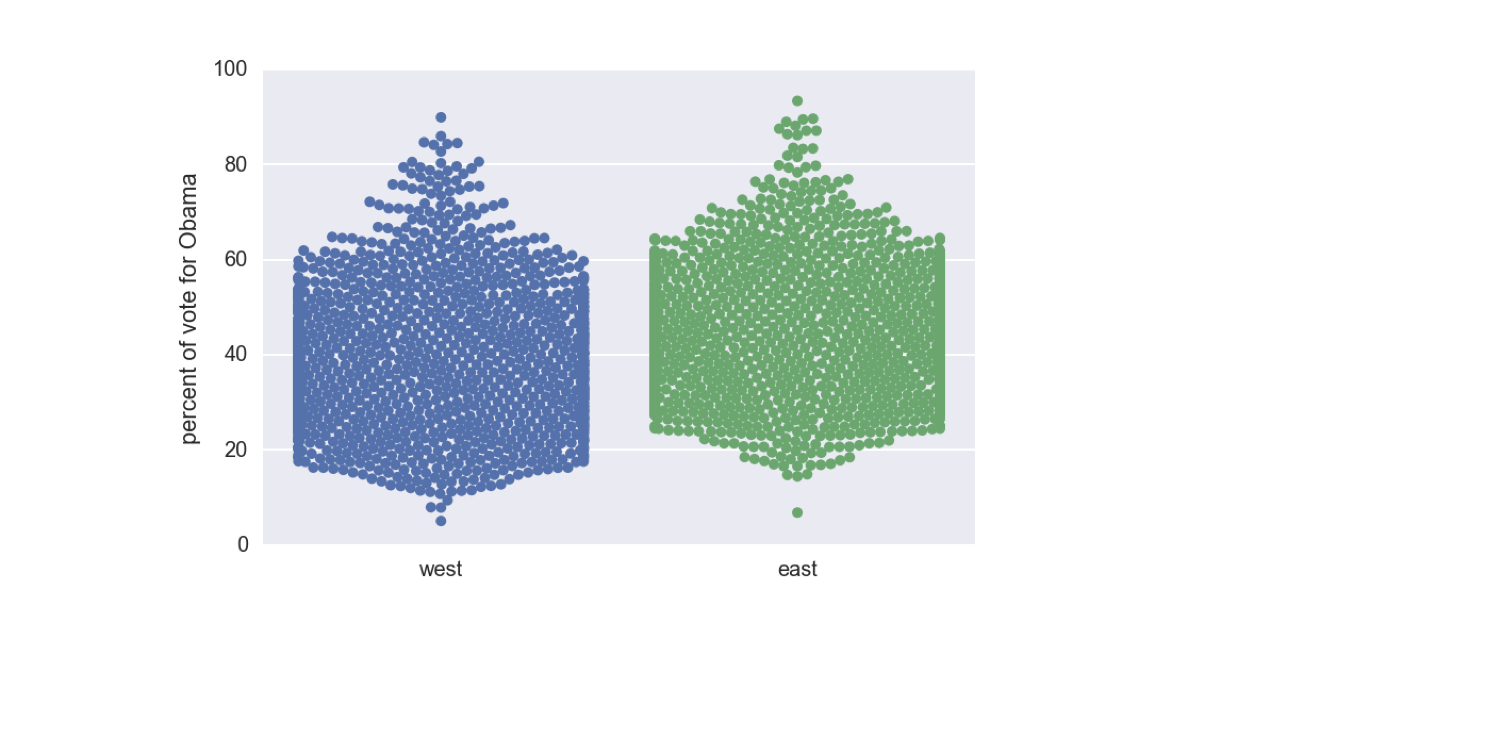
1 Data retrieved from Data.gov (https://www.data.gov/)
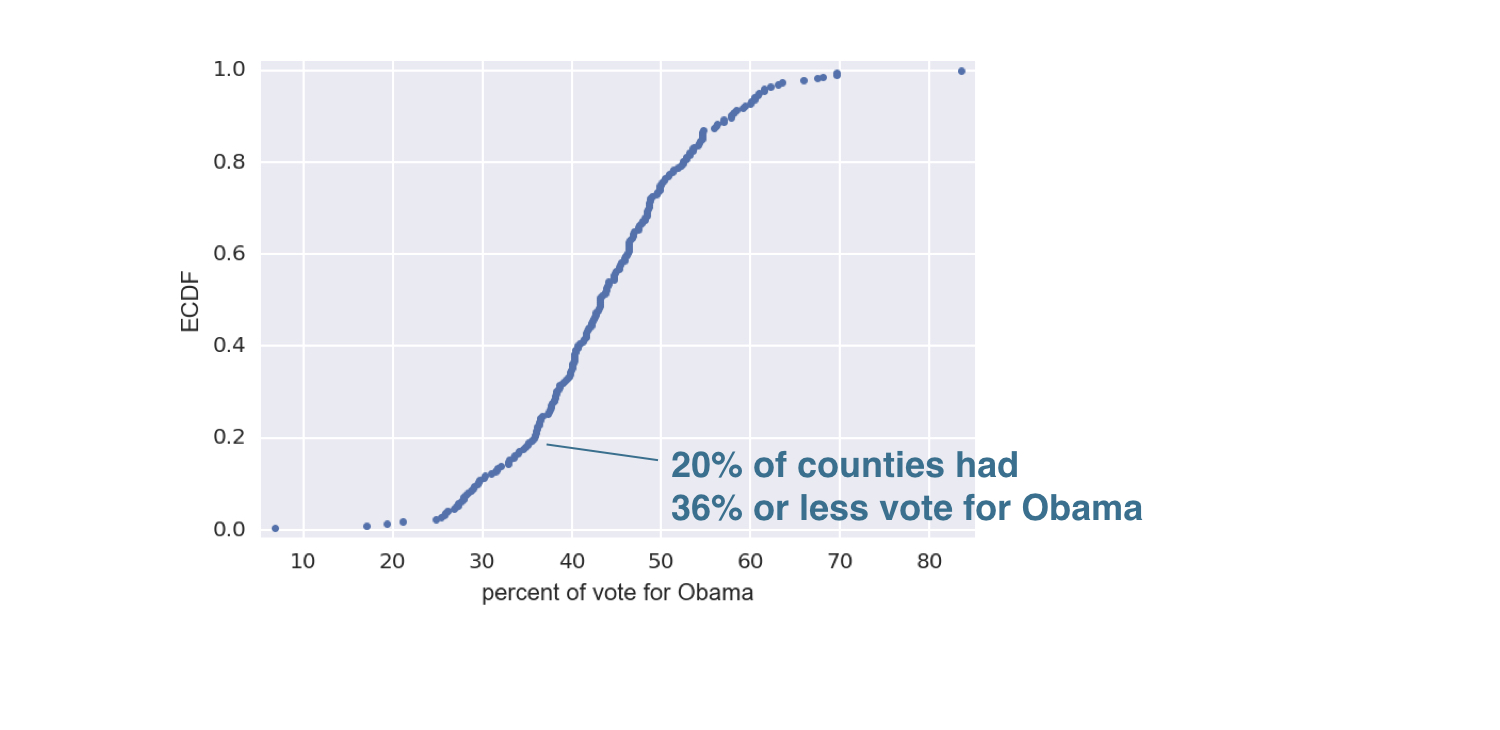
Empirical cumulative distribution function (ECDF)

1 Data retrieved from Data.gov (https://www.data.gov/)
Empirical cumulative distribution function (ECDF)
1 Data retrieved from Data.gov (https://www.data.gov/)
Empirical cumulative distribution function (ECDF)
1 Data retrieved from Data.gov (https://www.data.gov/)
2008 US swing state election ECDF
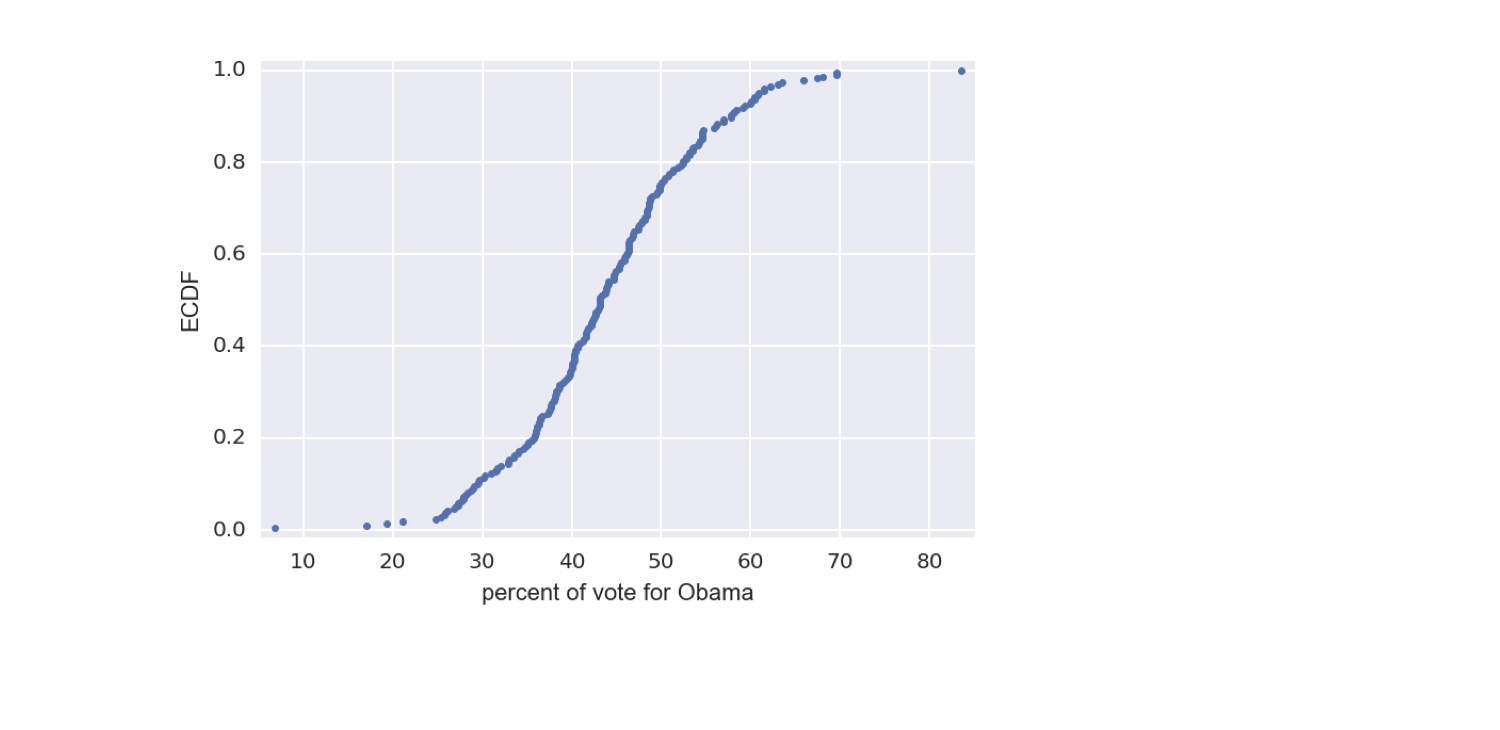
1 Data retrieved from Data.gov (https://www.data.gov/)
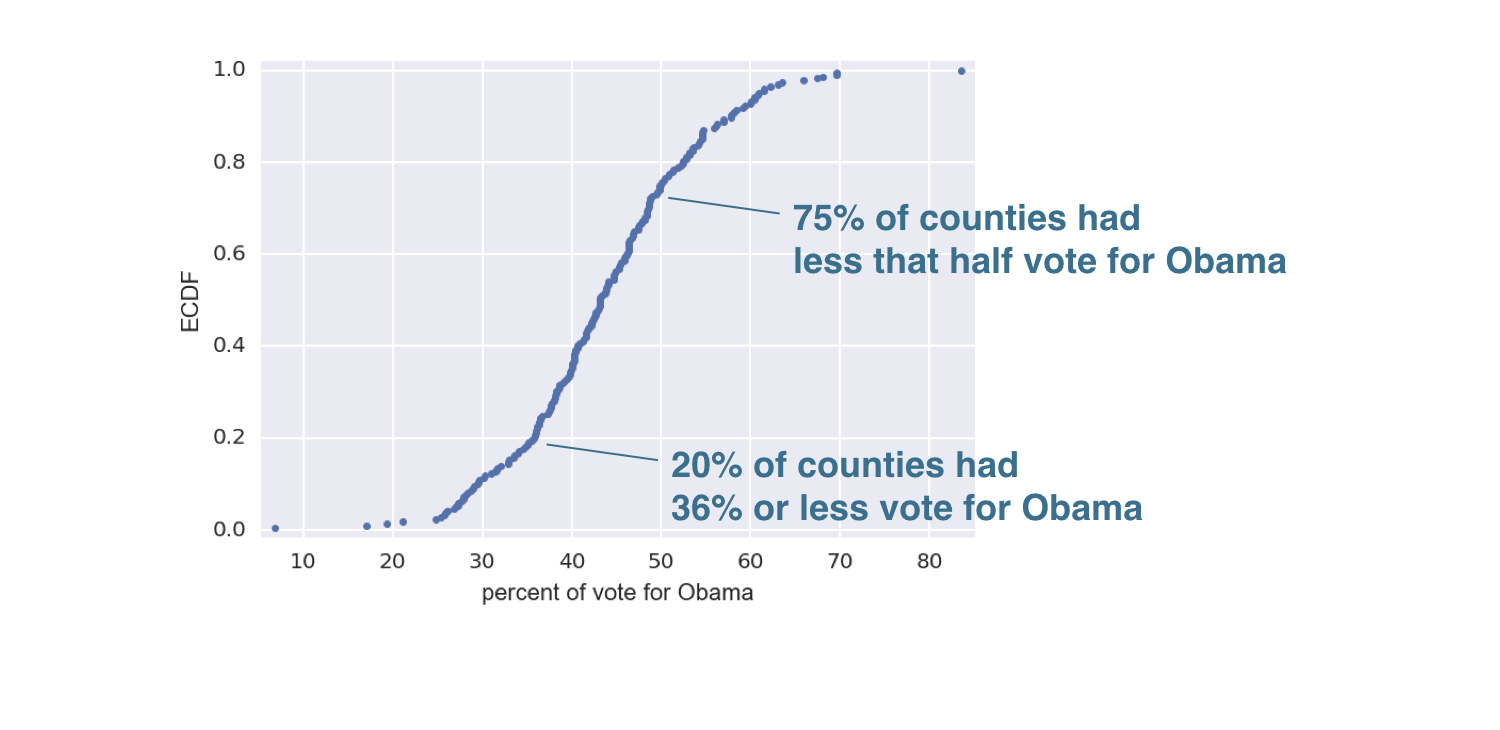
2008 US swing state election ECDFs
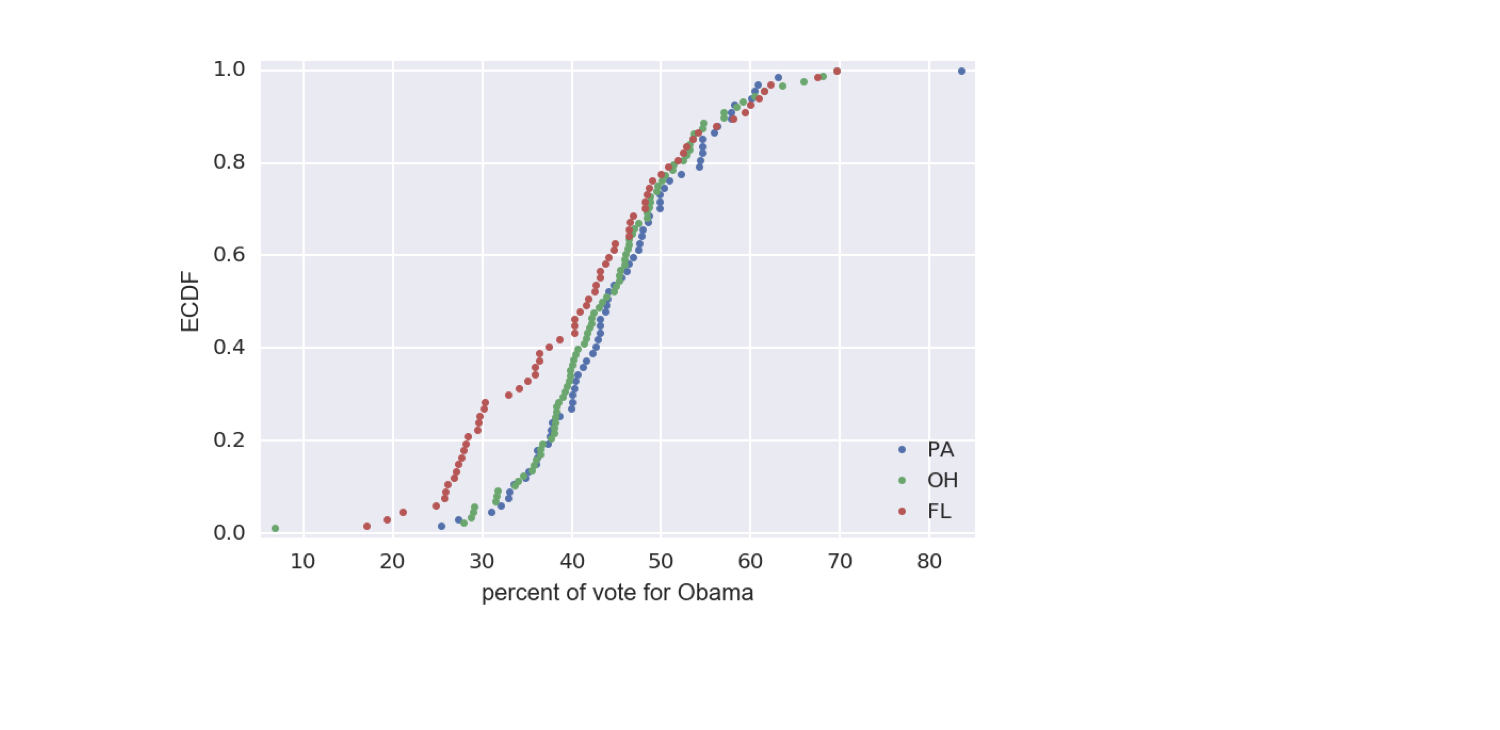
1 Data retrieved from Data.gov (https://www.data.gov/)

