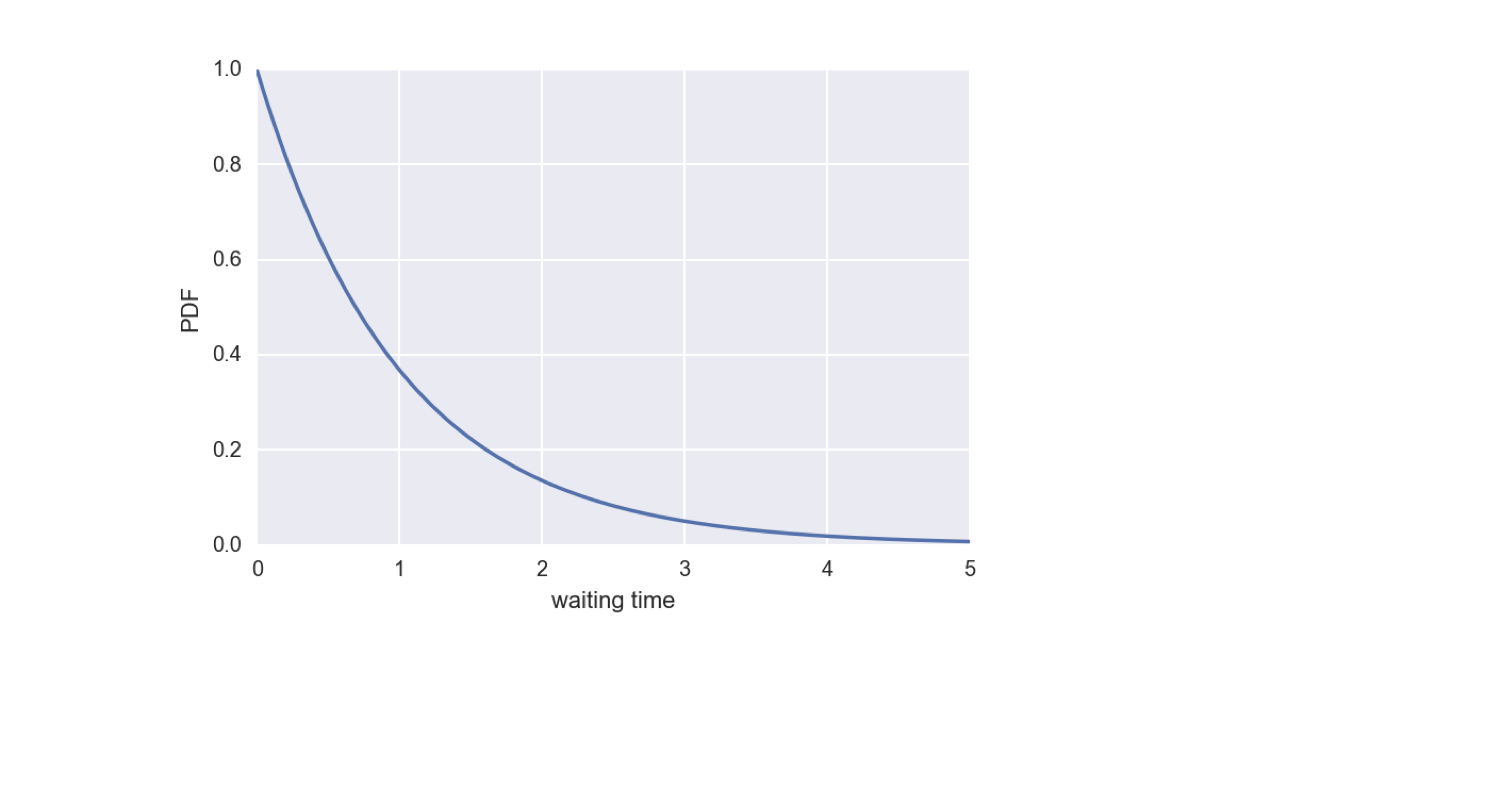
The Exponential distribution
Statistical Thinking in Python (Part 1)

Justin Bois
Teaching Professor at the California Institute of Technology
The Exponential PDF
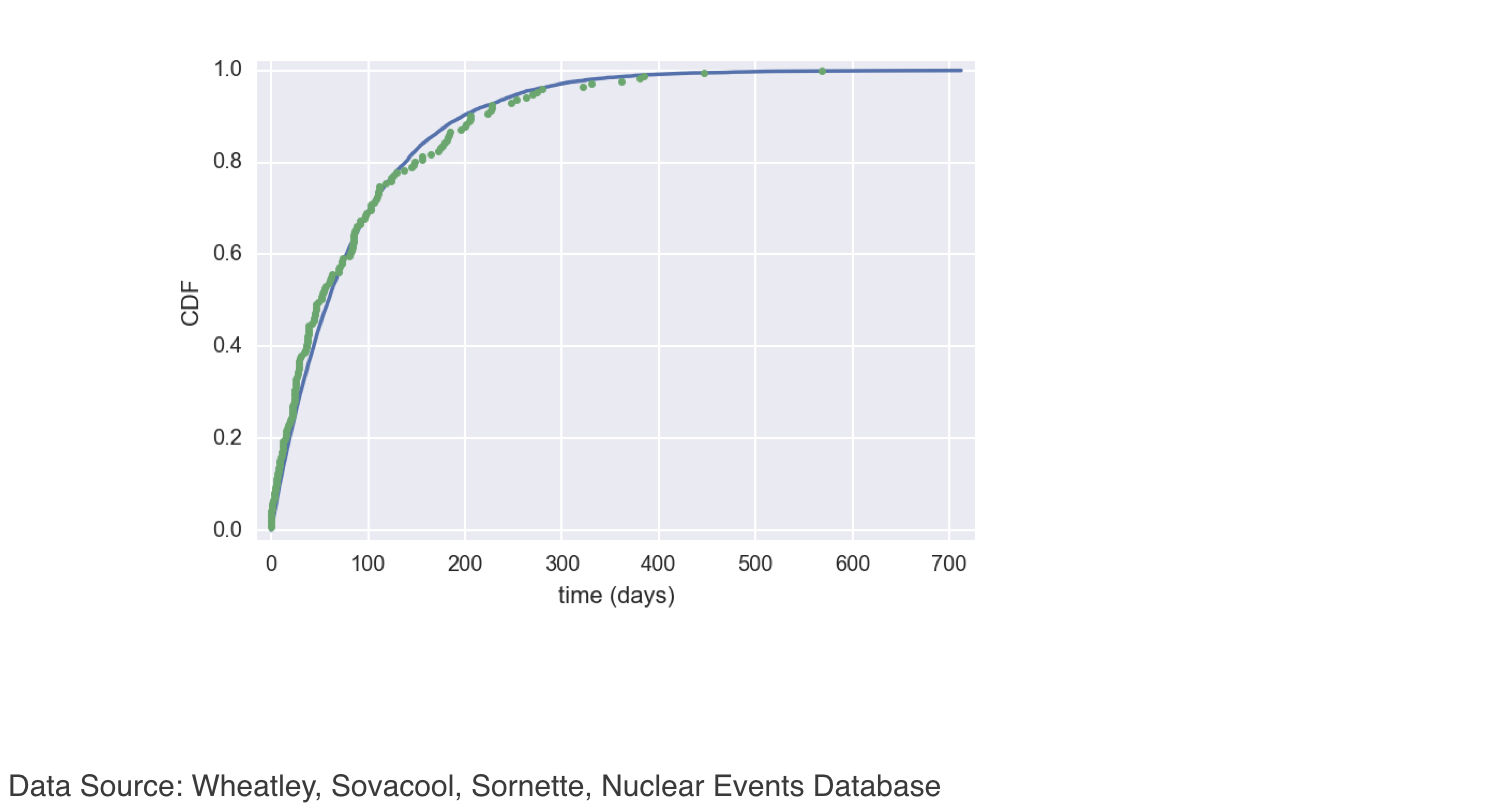
Exponential inter-incident times
Statistical Thinking in Python (Part 1)
Justin Bois
Teaching Professor at the California Institute of Technology

