Introduction to summary statistics: The sample mean and median
Statistical Thinking in Python (Part 1)

Justin Bois
Teaching Professor at the California Institute of Technology
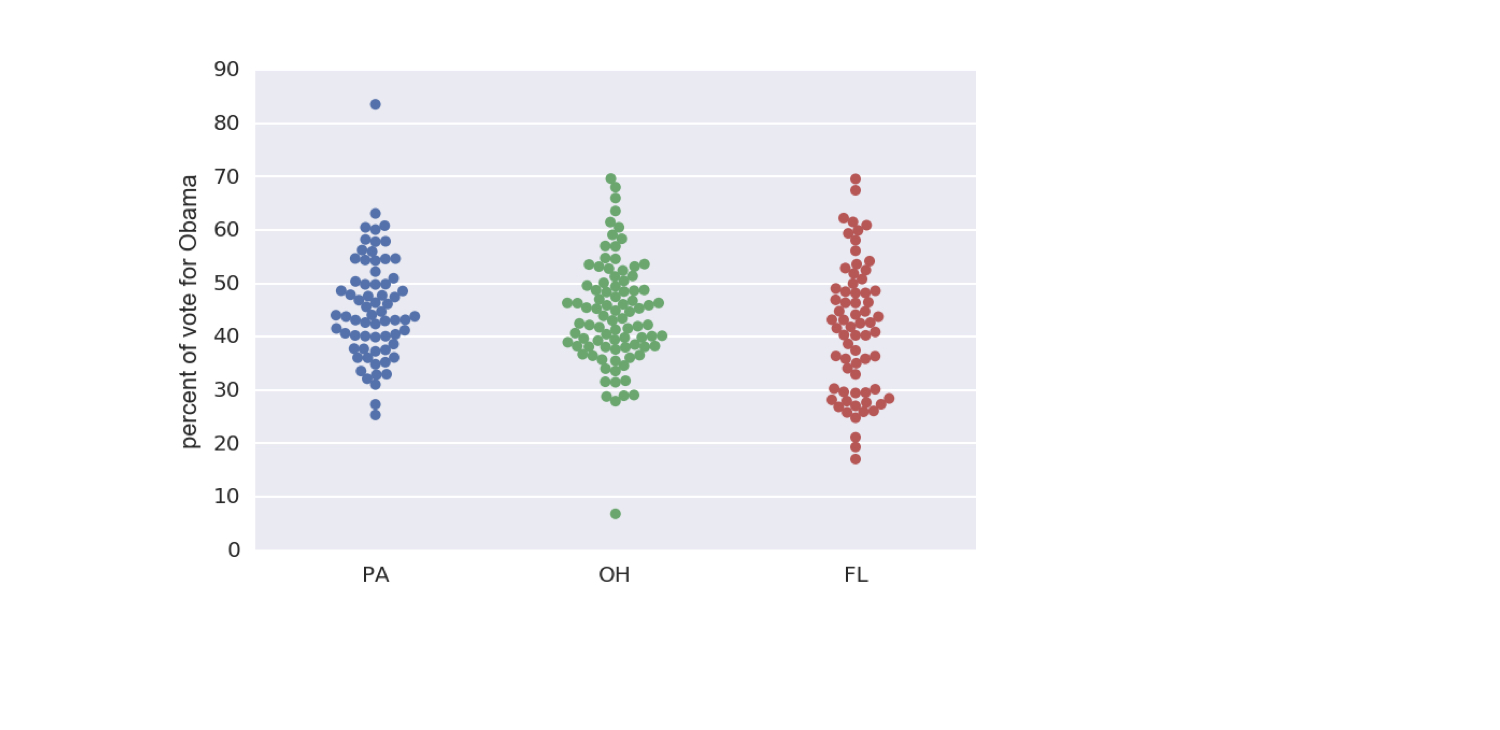
2008 US swing state election results

1 Data retrieved from Data.gov (https://www.data.gov/)
2008 US swing state election results

1 Data retrieved from Data.gov (https://www.data.gov/)
Mean vote percentage
import numpy as np
np.mean(dem_share_PA)
45.476417910447765
$$mean = \bar{x} = \frac{1}{n}\sum_{i=1}^{n}x_i$$
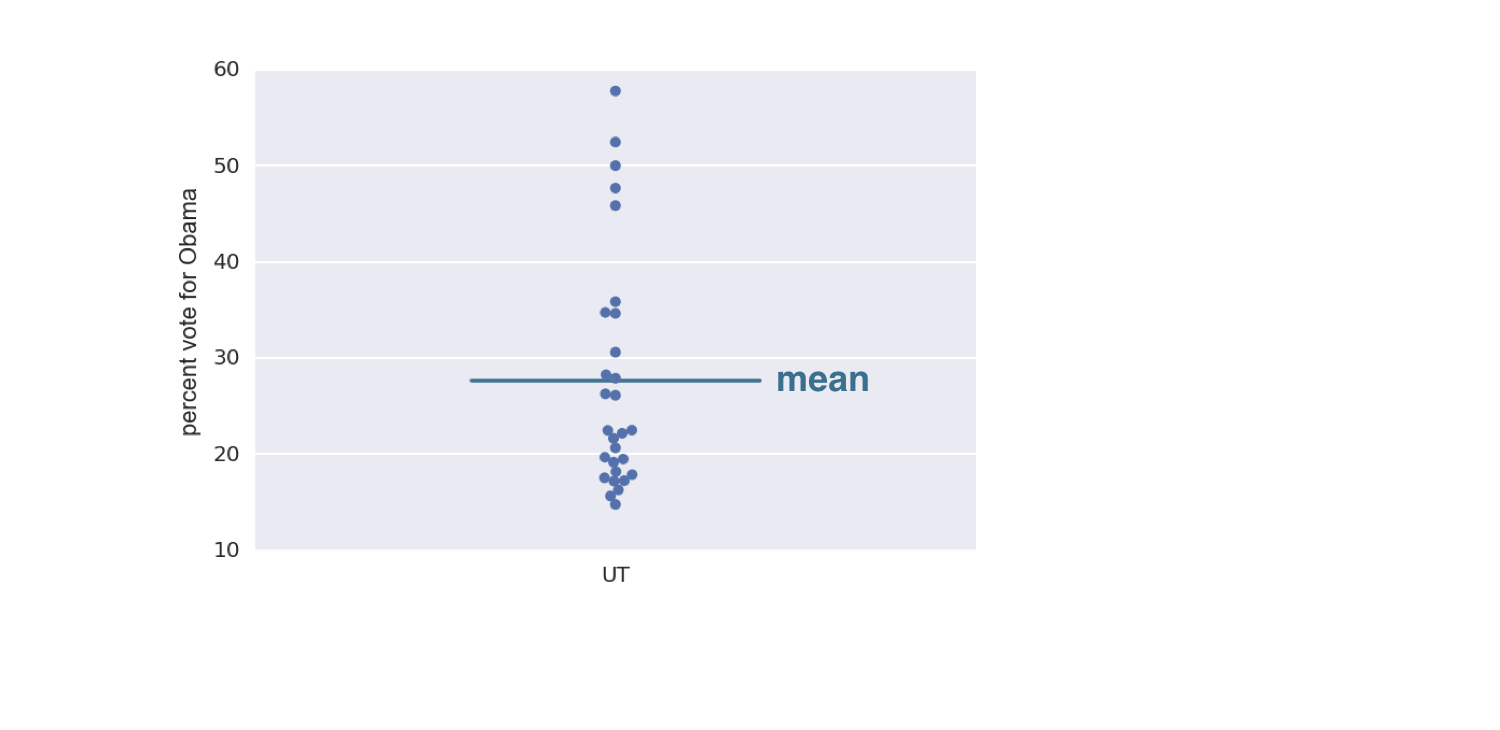
Outliers
- Data points whose value is far greater or less than most of the rest of the data
2008 Utah election results

1 Data retrieved from Data.gov (https://www.data.gov/)
2008 Utah election results

1 Data retrieved from Data.gov (https://www.data.gov/)
The median
- The middle value of a data set
2008 Utah election results

1 Data retrieved from Data.gov (https://www.data.gov/)
Computing the median
np.median(dem_share_UT)
22.469999999999999
Let's practice!
Statistical Thinking in Python (Part 1)

