Bootstrap confidence intervals
Statistical Thinking in Python (Part 2)

Justin Bois
Lecturer at the California Institute of Technology
Bootstrap estimate of the mean

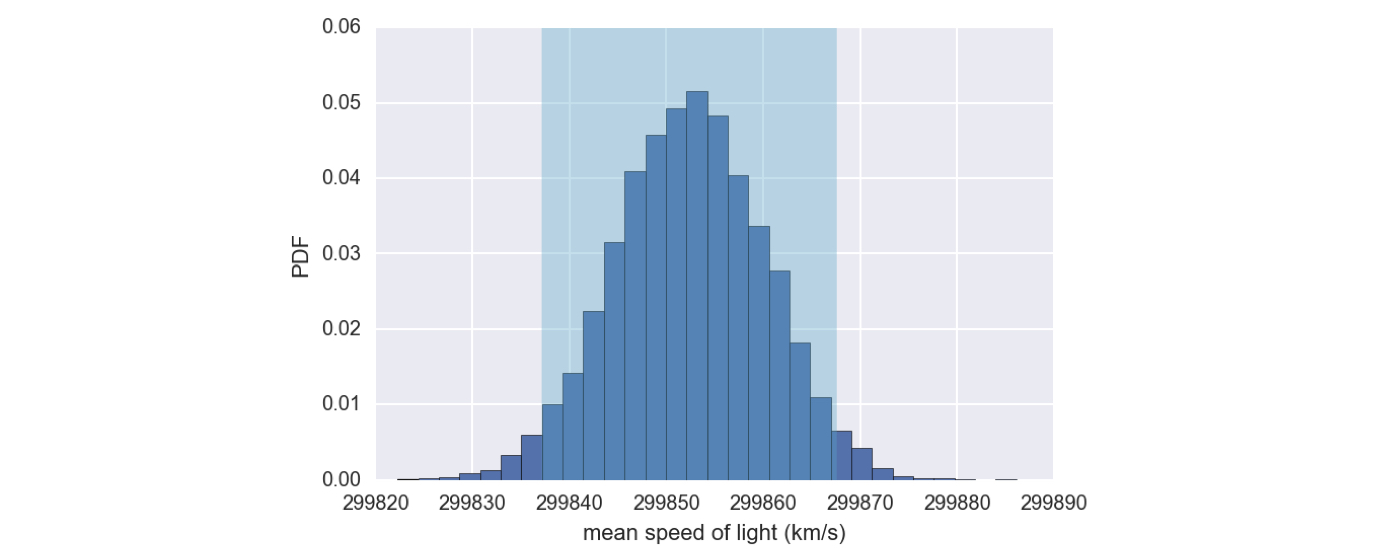
Bootstrap confidence interval
conf_int = np.percentile(bs_replicates, [2.5, 97.5])
array([ 299837., 299868.])