Putting it all together

Marketing Analytics in Google Sheets

Luke Pajer

Digital Marketing Specialist

Cleaning up the visuals

  • Common reporting issues

    • Messy charts
    • Too many charts
  • Avoid adding too many charts to a dashboard

    • Adding a dynamic dropdown makes for a better experience

Bad_Chart.png

Marketing Analytics in Google Sheets

How to make a dashboard dynamic?

Step 1: Add data validation dropdown

Step 2: Create the filtered table and charts

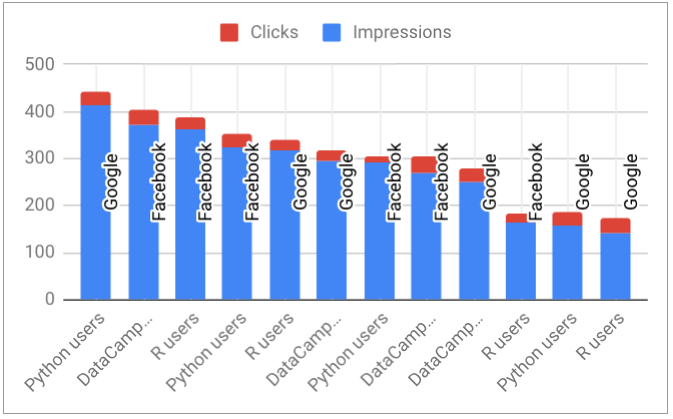
Step 3: Link chart to the filtered table

Example data set

Example Data Set

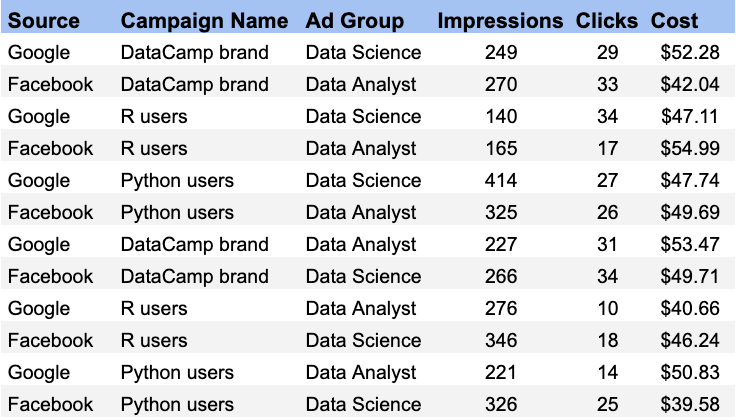
Using the example dataset...

Dropdown.gif

Marketing Analytics in Google Sheets

Step 2: filter the table with two conditions

Filter the example data set using both the dropdowns:

=IF(len(A3) > 1, 
    IF(A2 = "", 
    FILTER(A1:F29, 
           REGEXMATCH(C1:C29, A3)), 
    FILTER(A1:F29, 
           REGEXMATCH(C1:C29, A3), 
           REGEXMATCH(A1:A29, A2))), 
    A2:F29)

A2 is the Source dropdown selection
A3 is the Ad Group dropdown selection

Marketing Analytics in Google Sheets

Step 3: link filtered table to chart

Link the filtered table to each of the charts in the dashboard

When the table changes, the charts will reflect the change

Be sure to test out a few filter combinations

dashboard in action

Marketing Analytics in Google Sheets

Let's get to work!

Marketing Analytics in Google Sheets

Preparing Video For Download...