Build a digital marketing dashboard

Marketing Analytics in Google Sheets

Luke Pajer

Digital Marketing Specialist

Dashboard overview

  • Dashboards are used to relay information in a timely manner
  • Typically includes only basic, easy to understand information
  • Usually made up of charts, but may contain data tables as well
  • Used for decision making:
    • Determining a campaign budget based on performance
    • Allocating resources to fix poor performing ad groups
Marketing Analytics in Google Sheets

First look at a dashboard

dashboard

Marketing Analytics in Google Sheets

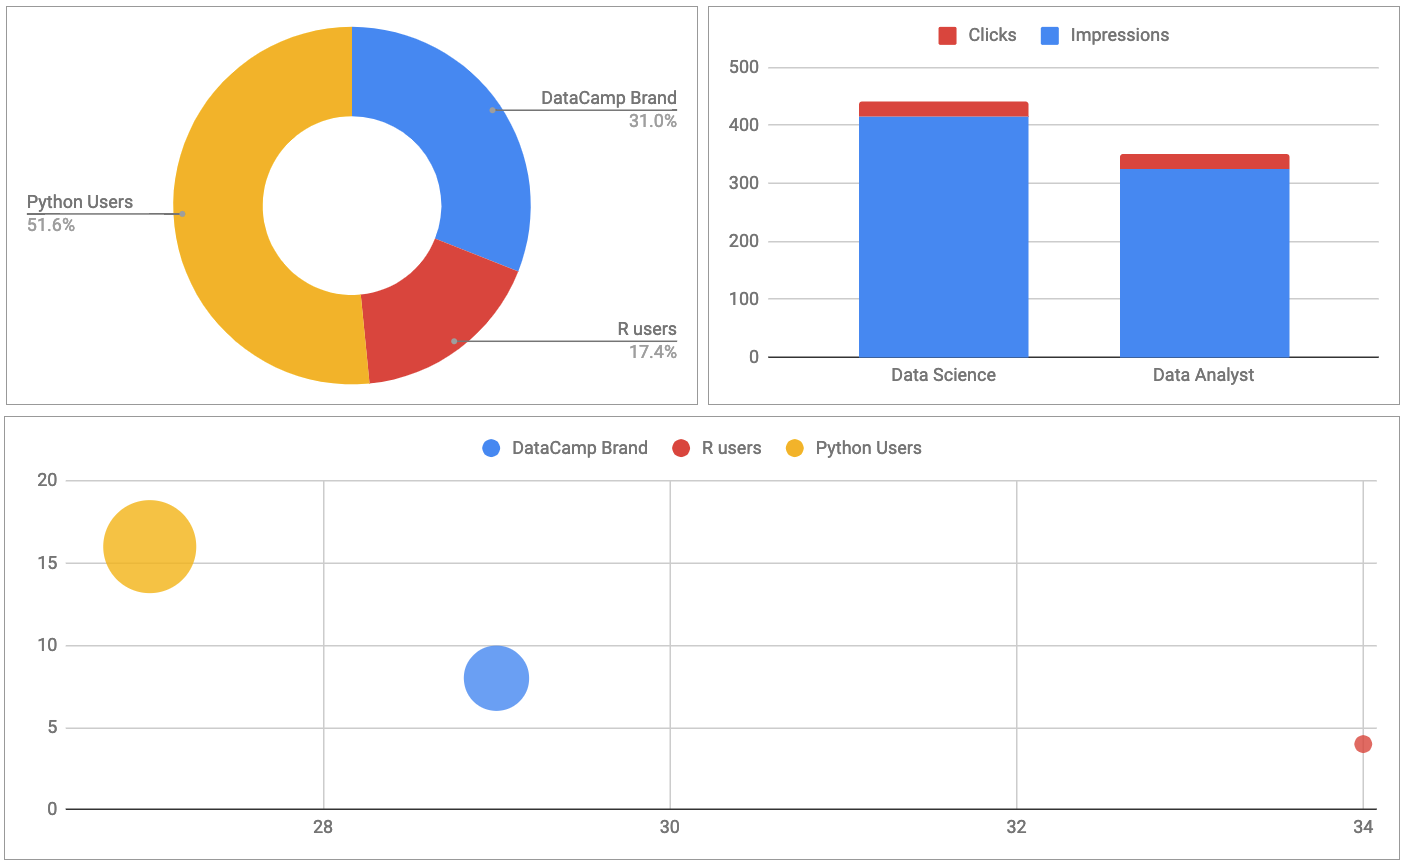
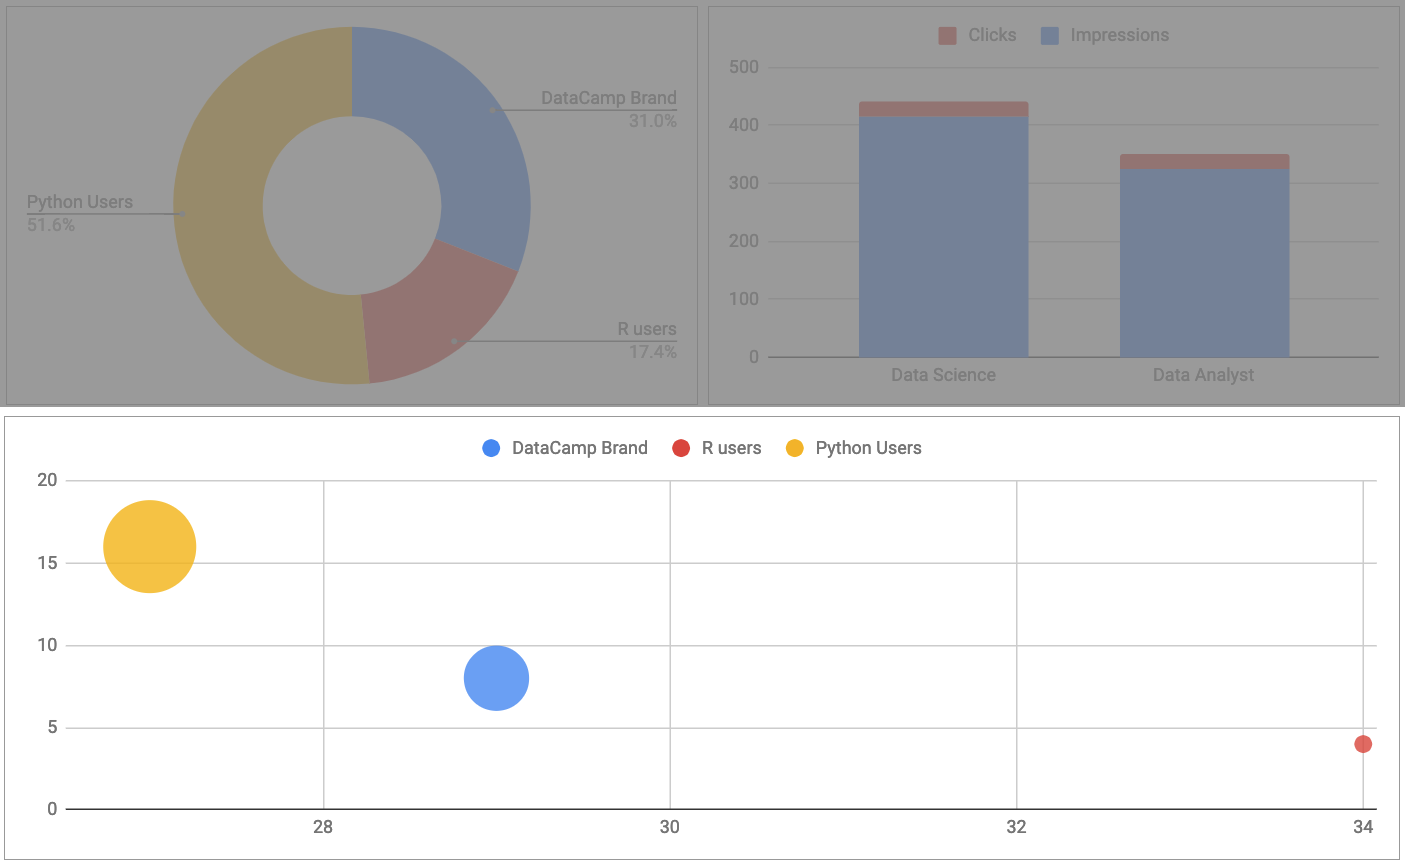
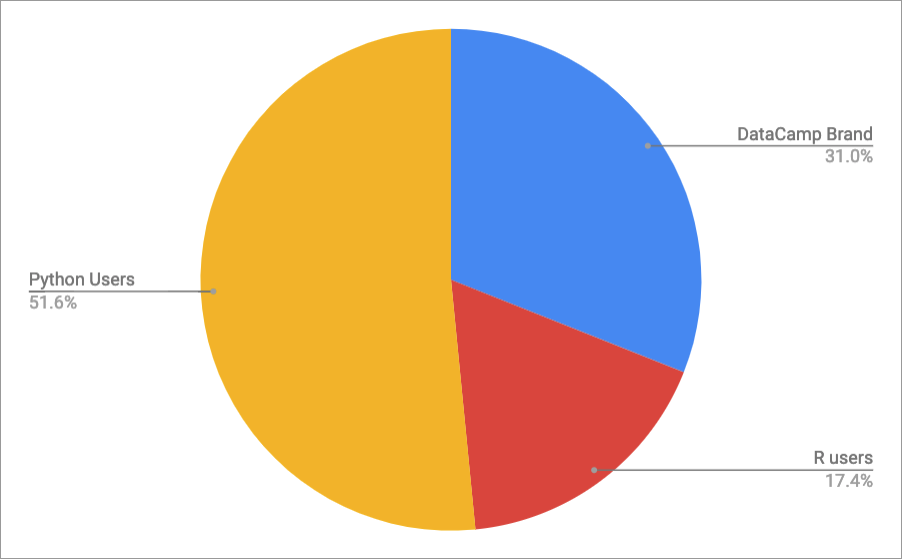
Dashboard charts review: doughnut/pie charts

  • Display relative make up of total
  • Same as a pie chart except it has a hole in the middle

pie chart

dashboard pie chart

Marketing Analytics in Google Sheets

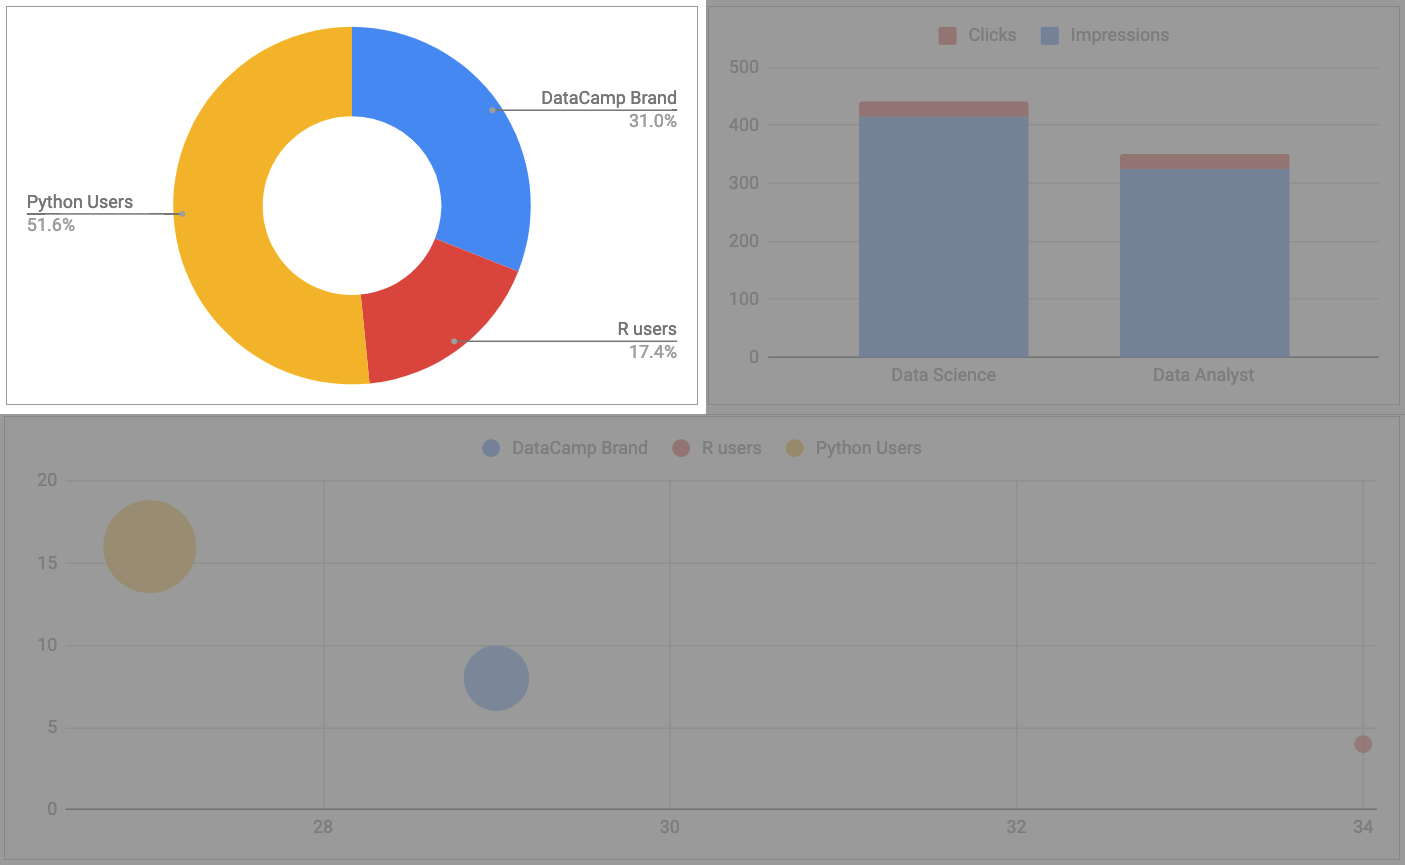
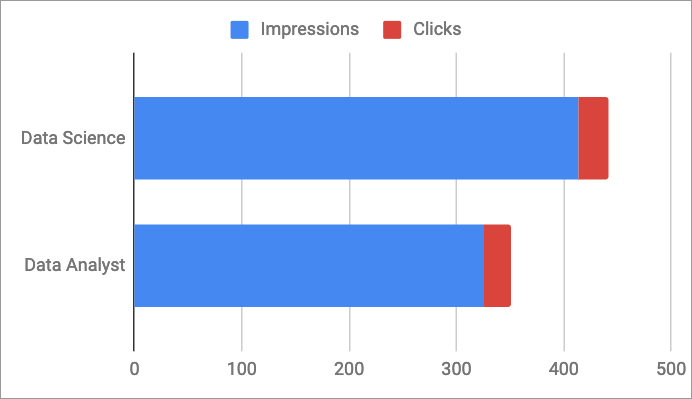
Dashboard charts review: stacked column/bar chart

  • Visualize a few metrics at a time, as a single bar
  • Bar chart is the same as a column chart, except the labels are on the y-axis (pictured below)

bar chart

dashboard column chart

Marketing Analytics in Google Sheets

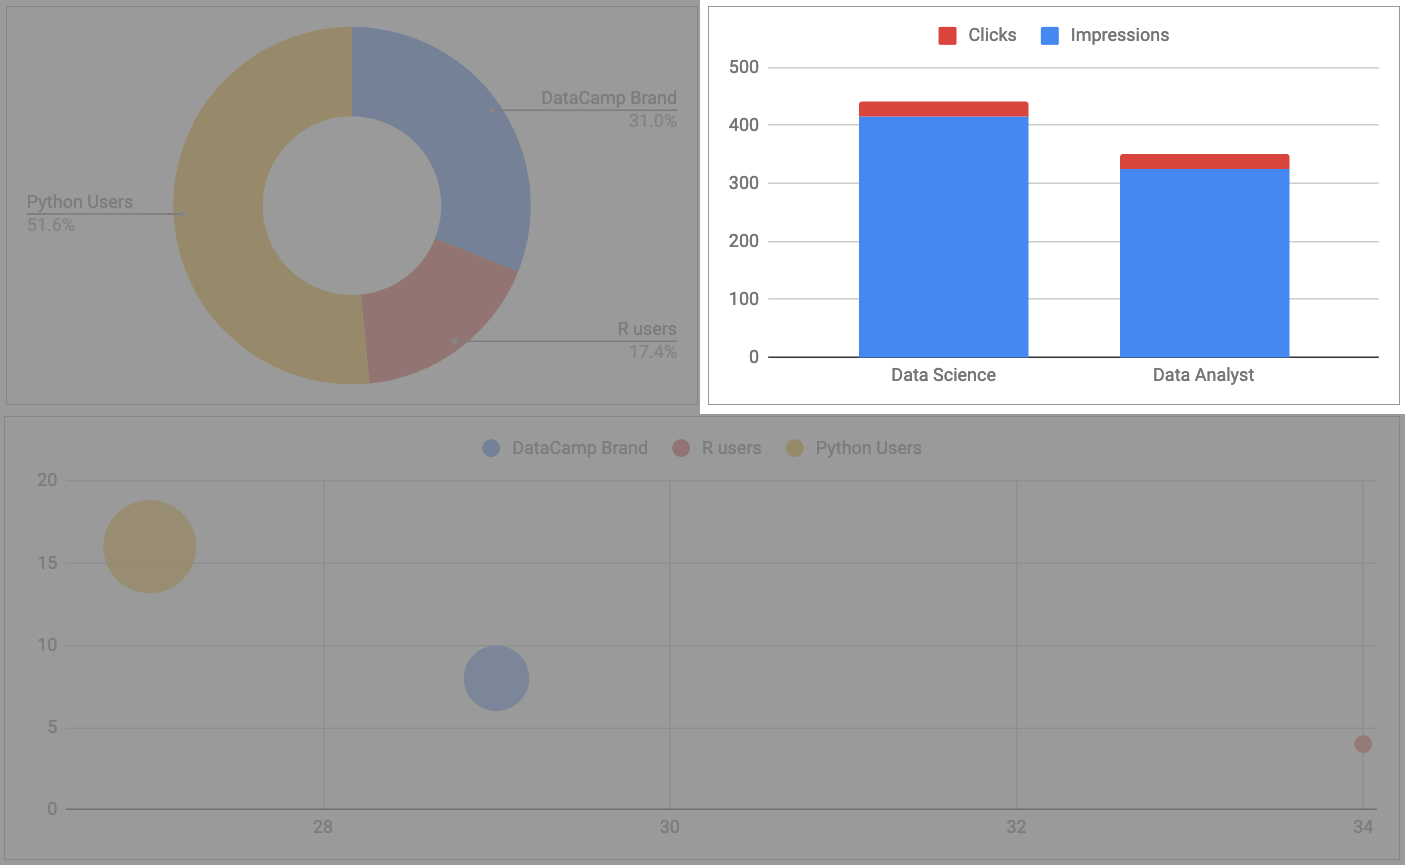
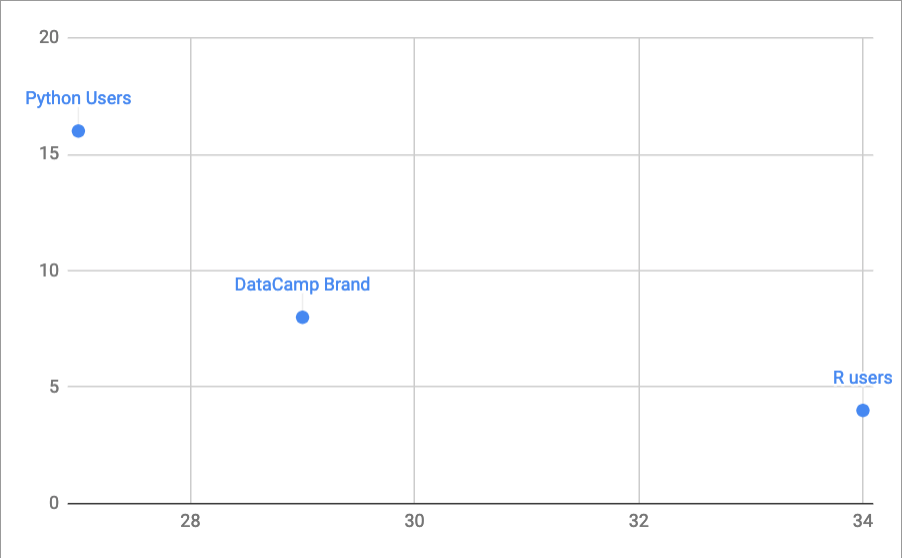
Dashboard charts review: scatter/bubble chart

  • Visualize the relationships between metrics
  • A scatter chart is the same as a bubble chart, except it does not have weights (pictured below) scatter chart

dashboard bubble chart

Marketing Analytics in Google Sheets

Chapter wrap-up

  • Marketing director needs the following dashboard
    • Compare the sources
    • Show the percent of impressions by source
    • Show the relationship between clicks, goal completions, and impressions
    • Show the total number of impressions, clicks, and goal completions by source
Marketing Analytics in Google Sheets

Let's get to work!

Marketing Analytics in Google Sheets

Preparing Video For Download...