Welcome to the course!
Intermediate Portfolio Analysis in R

Ross Bennett
Instructor
What you will learn
Build on fundamental concepts from "Introduction to Portfolio Analysis in R"
Explore advanced concepts in the portfolio optimization process
Use the R package
PortfolioAnalyticsto solve portfolio optimization problems that mirror real world problems
Modern Portfolio Theory
Modern Portfolio Theory (MPT) was introduced by Harry Markowitz in 1952.
MPT states that an investor's objective is to maximize portfolio expected return for a given amount of risk.
Common Objectives:
Maximize a measure of gain per unit measure of risk
Minimize a measure of risk
Mean - Standard Deviation Example: Setup
library(PortfolioAnalytics)
data(edhec)
data <- edhec[,1:8]
# Create the portfolio specification
port_spec <- portfolio.spec(colnames(data))
port_spec <- add.constraint(portfolio = port_spec, type = "full_investment")
port_spec <- add.constraint(portfolio = port_spec, type = "long_only")
port_spec <- add.objective(portfolio = port_spec, type = "return", name = "mean")
port_spec <- add.objective(portfolio = port_spec, type = "risk", name = "StdDev")
**************************************************
PortfolioAnalytics Portfolio Specification
**************************************************
Call:
portfolio.spec(assets = colnames(data))

Number of assets: 8
Asset Names
[1] "Convertible Arbitrage"  "CTA Global"             "Distressed Securities"
[4] "Emerging Markets"       "Equity Market Neutral"  "Event Driven"
[7] "Fixed Income Arbitrage" "Global Macro"

Constraints
Enabled constraint types
        - full_investment
        - long_only

Objectives:
Enabled objective names
        - mean
        - StdDev
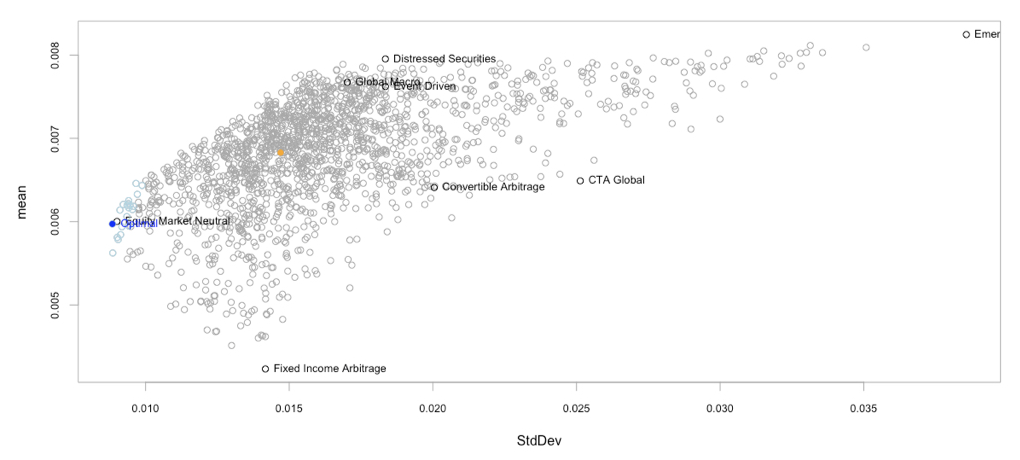
Mean - Standard Deviation Example: Optimize
# Run optimization and chart results in risk-reward space
opt <- optimize.portfolio(data,
                   portfolio = port_spec,
                   optimize_method = "random",
                   trace = TRUE)
chart.RiskReward(opt,
                 risk.col = "StdDev",
                 return.col = "mean",
                 chart.assets = TRUE)
Mean - Standard Deviation Example: Optimize
Let's practice!
Intermediate Portfolio Analysis in R

