Correlation
Analyzing IoT Data in Python

Matthias Voppichler
IT Developer
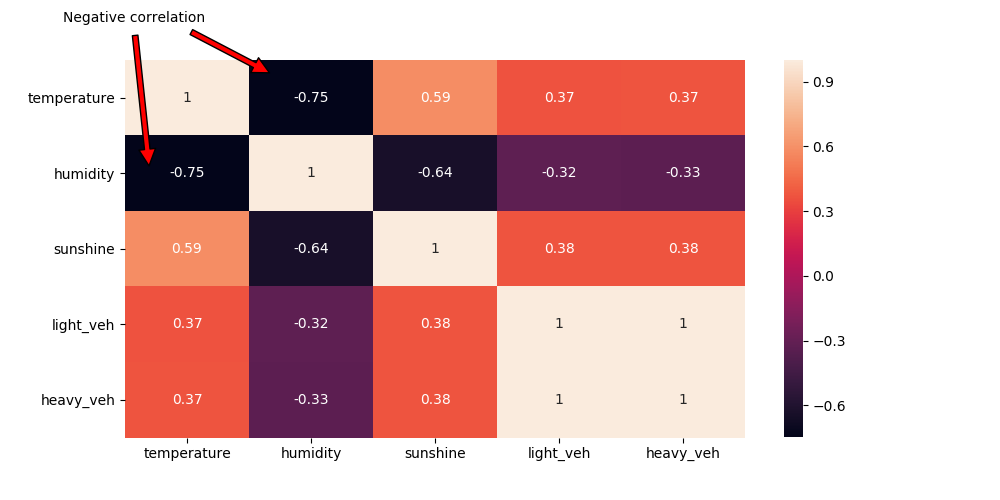
heatmap
sns.heatmap(data.corr(), annot=True)

heatmap
sns.heatmap(data.corr(), annot=True)
heatmap
sns.heatmap(data.corr(), annot=True)

heatmap
sns.heatmap(data.corr(), annot=True)

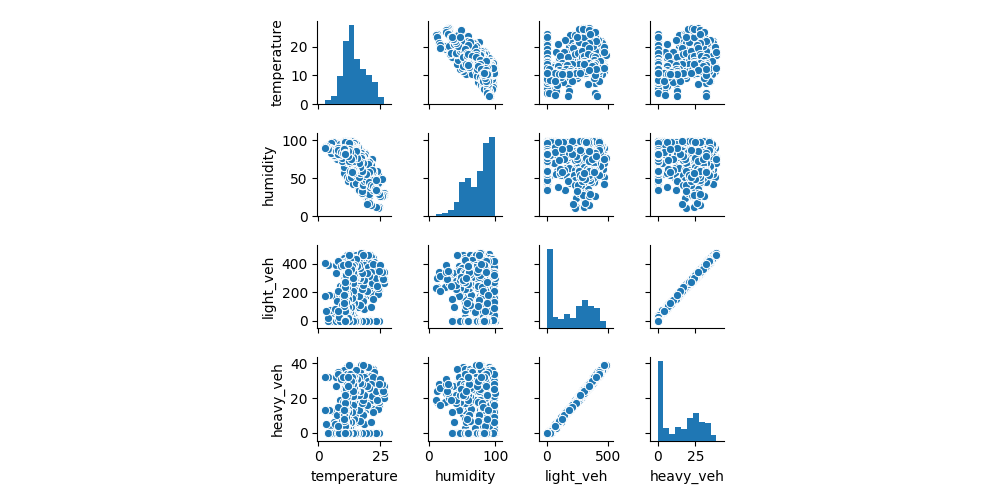
Pairplot
sns.pairplot(data)