Prepare and visualize incremental data
Analyzing IoT Data in Python

Matthias Voppichler
IT Developer
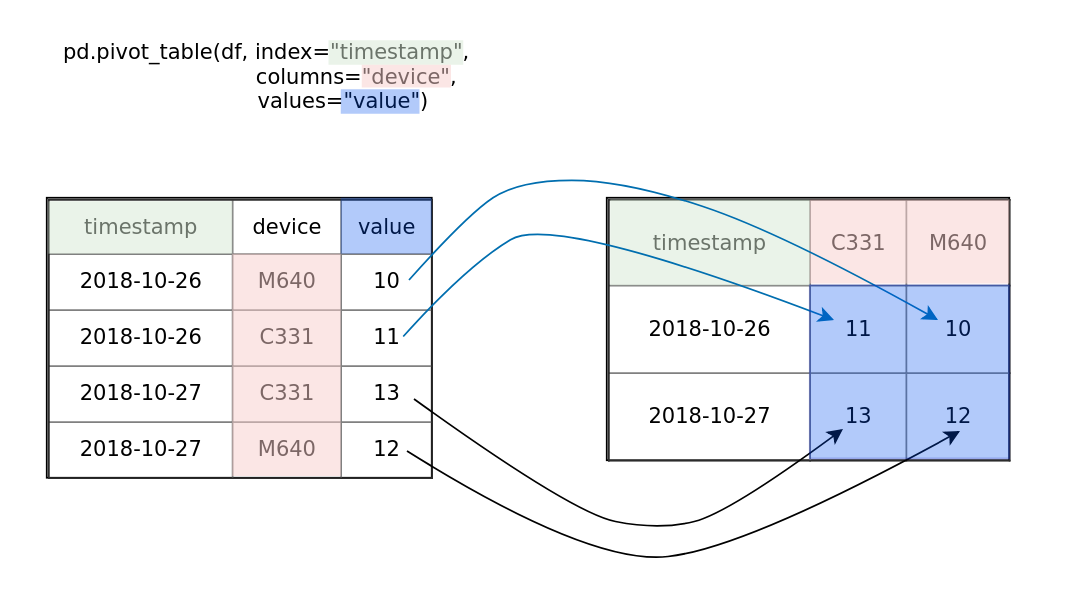
Pivot table
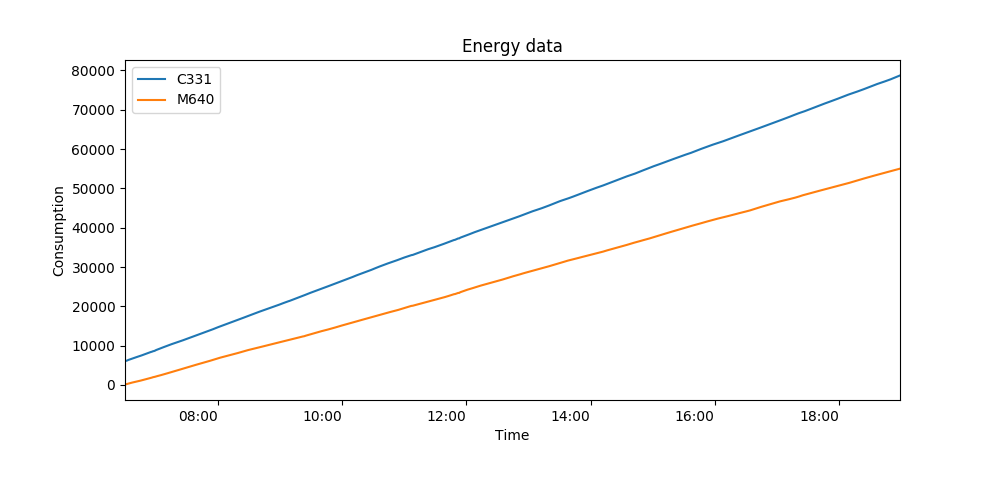
Visualize data
data.plot()
plt.show()
pd.diff()
# Difference
df_diff = data.diff(1)
df_diff.plot()
plt.show()
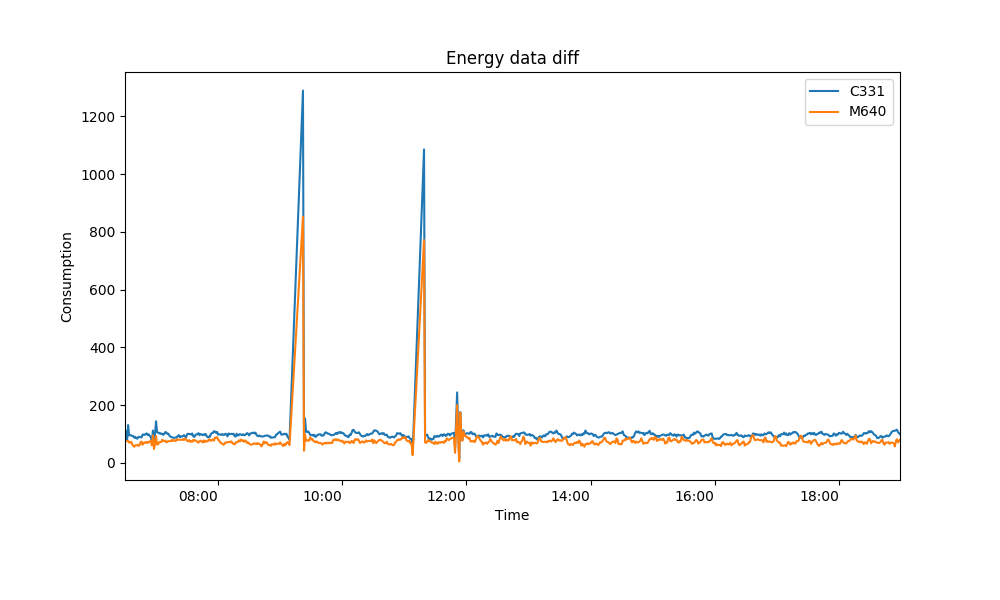
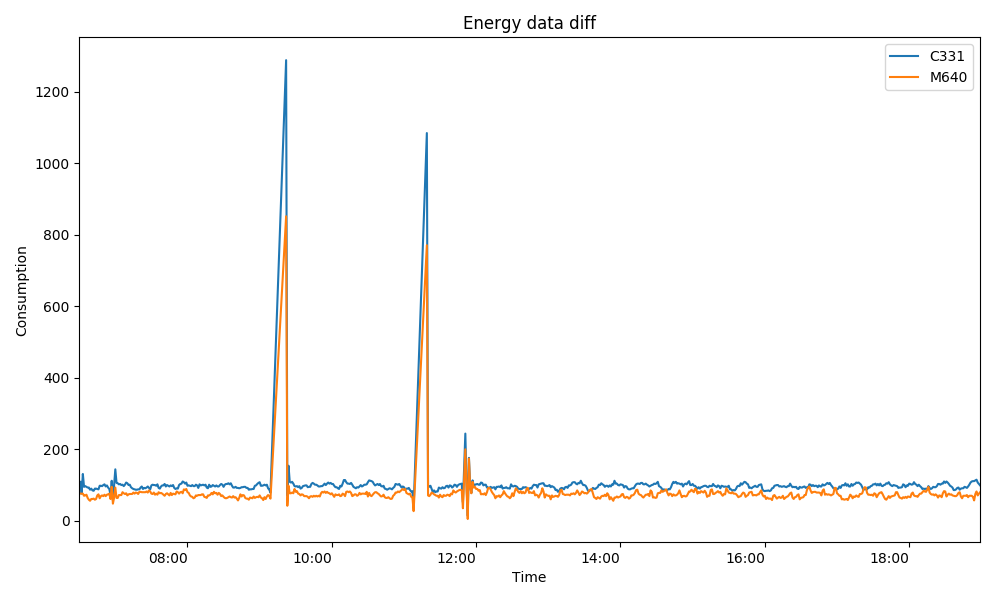
Data analysis - difference
# Difference
df_diff = data.diff()
df_diff.plot()
plt.show()
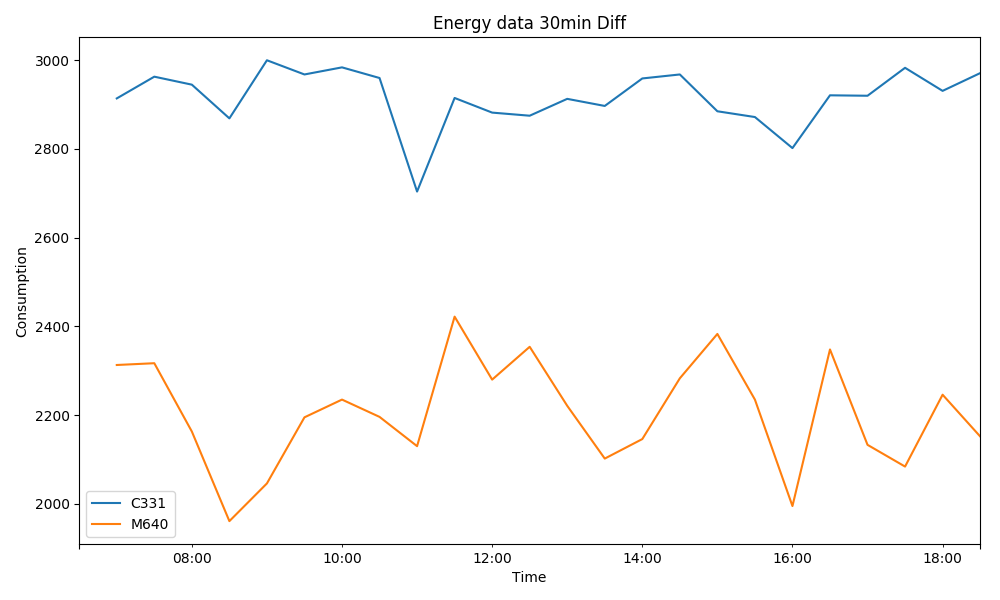
# Resampled difference
df = data.resample('30min').max()
df_diff = df.diff()
df_diff.plot()
plt.show()
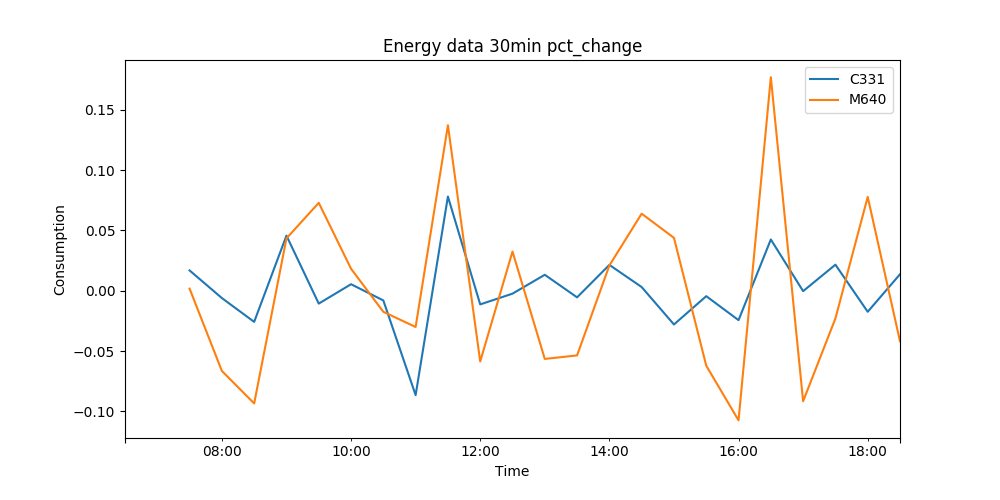
Change percentage
df_pct = df_diff.pct_change()
df_pct.plot()