Clean Data
Analyzing IoT Data in Python

Matthias Voppichler
IT Developer
Missing data
Reasons for missing data from IoT devices
- Unstable network connection
- No power
- Other External factors
Times to deal with data quality
- During data collection
- During analysis
Dealing with missing data
Methods to deal with missing data
- fill
- mean
- median
- forward-fill
- backward-fill
- drop
- stop analysis
Detecting missing values
df.info()
<class 'pandas.core.frame.DataFrame'>
DatetimeIndex: 12 entries, 2018-10-15 08:00:00 to 2018-10-15 08:55:00
Data columns (total 3 columns):
temperature      8 non-null float64
humidity         8 non-null float64
precipitation    12 non-null float64
dtypes: float64(3)
memory usage: 384.0 bytes
Drop missing values
print(df.head())
                     temperature  humidity  precipitation
timestamp
2018-10-15 08:00:00         16.7      64.2            0.0
2018-10-15 08:05:00         16.6       NaN            0.0
2018-10-15 08:10:00         16.5      65.3            0.0
2018-10-15 08:15:00          NaN      65.0            0.0
2018-10-15 08:20:00         16.8      64.3            0.0
df.dropna()
                     temperature  humidity  precipitation
timestamp
2018-10-15 08:00:00         16.7      64.2            0.0
2018-10-15 08:10:00         16.5      65.3            0.0
2018-10-15 08:20:00         16.8      64.3            0.0
Fill missing values
df
                     temperature  humidity  precipitation
timestamp
2018-10-15 08:00:00         16.7      64.2            0.0
2018-10-15 08:05:00         16.6       NaN            0.0
2018-10-15 08:10:00         17.0      65.3            0.0
2018-10-15 08:15:00          NaN      65.0            0.0
2018-10-15 08:20:00         16.8      64.3            0.0
df.fillna(method="ffill")
                     temperature  humidity  precipitation
timestamp
2018-10-15 08:00:00         16.7      64.2            0.0
2018-10-15 08:05:00         16.6      64.2            0.0
2018-10-15 08:10:00         17.0      65.3            0.0
2018-10-15 08:15:00         17.0      65.0            0.0
2018-10-15 08:20:00         16.8      64.3            0.0
Interrupted Measurement
print(df.head())
timestamp            temperature  humidity
2018-10-15 00:00:00         13.5      84.7
2018-10-15 00:10:00         13.3      85.6
2018-10-15 00:20:00         12.9      88.8
2018-10-15 00:30:00         12.8      89.2
2018-10-15 00:40:00         13.0      87.7
print(df.isna().sum())
temperature    0
humidity       0
dtype: int64
df_res = df.resample("10min").last()
print(df_res.head())
timestamp            temperature  humidity
2018-10-15 00:00:00         13.5      84.7
2018-10-15 00:10:00         13.3      85.6
2018-10-15 00:20:00         12.9      88.8
2018-10-15 00:30:00         12.8      89.2
2018-10-15 00:40:00         13.0      87.7
print(df_res.isna().sum())
temperature    34
humidity       34
dtype: int64
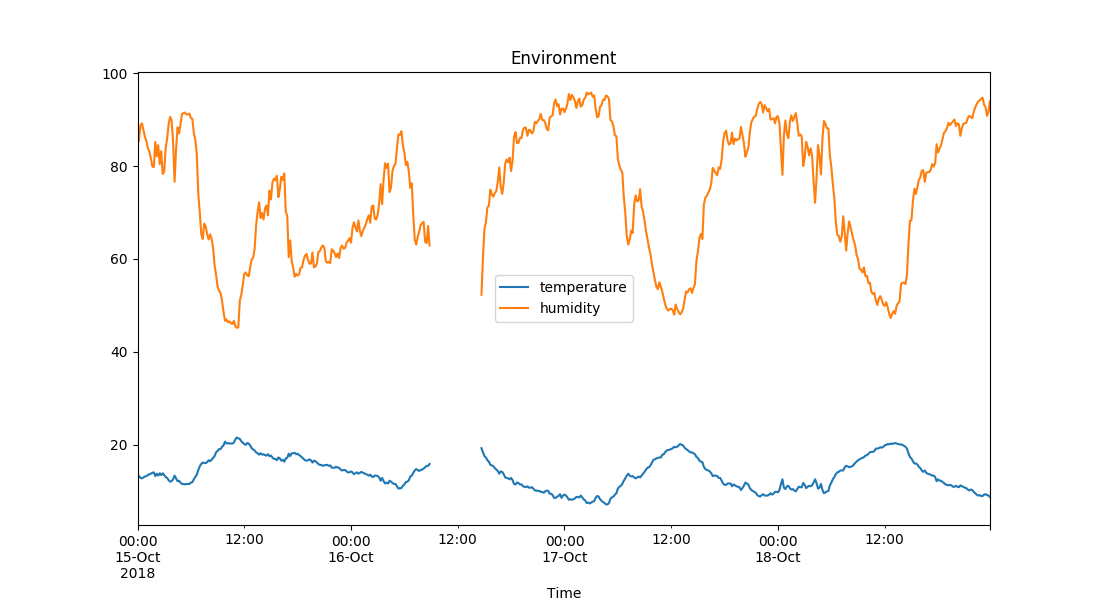
Interrupted Measurement
df_res.plot(title="Environment")

Let's practice!
Analyzing IoT Data in Python

