How to visualize data in Python?
Practicing Coding Interview Questions in Python

Kirill Smirnov
Data Science Consultant, Altran
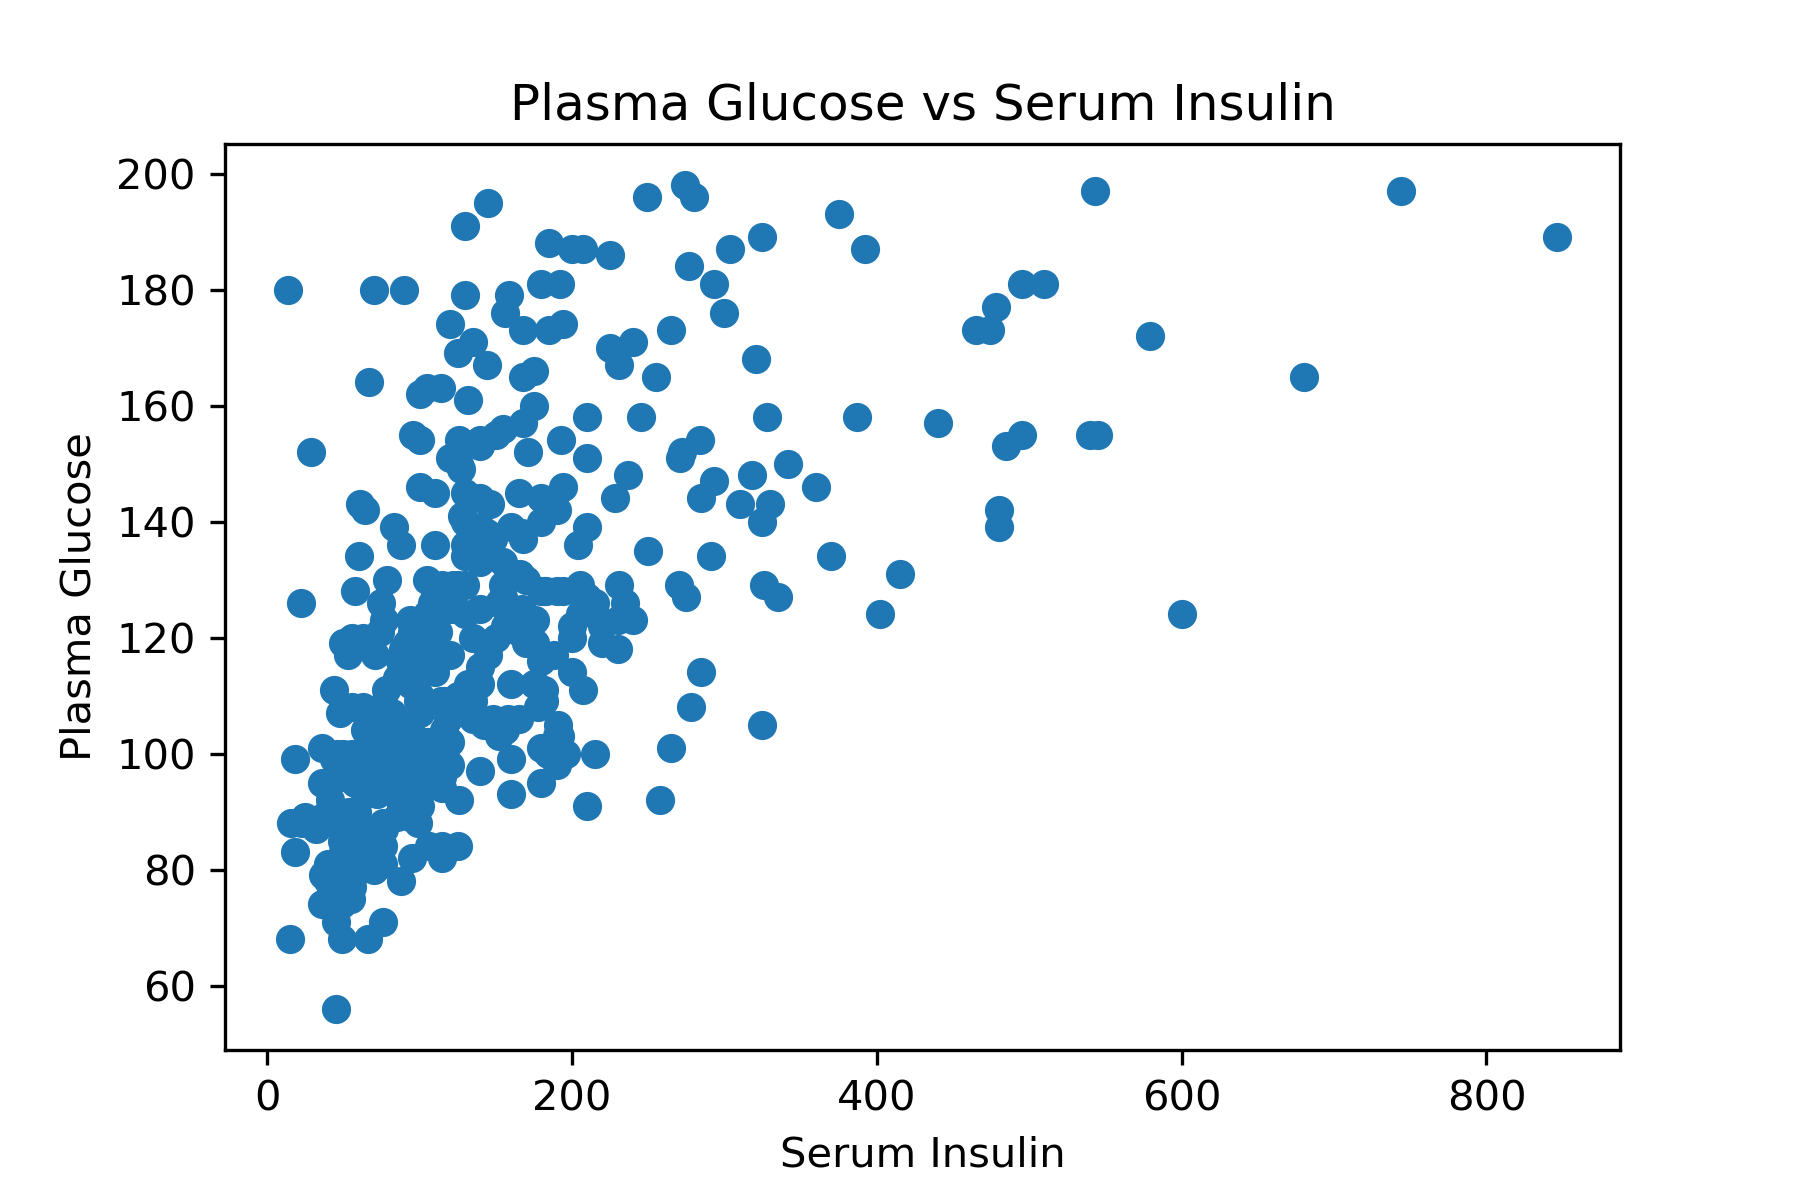
Scatter plot
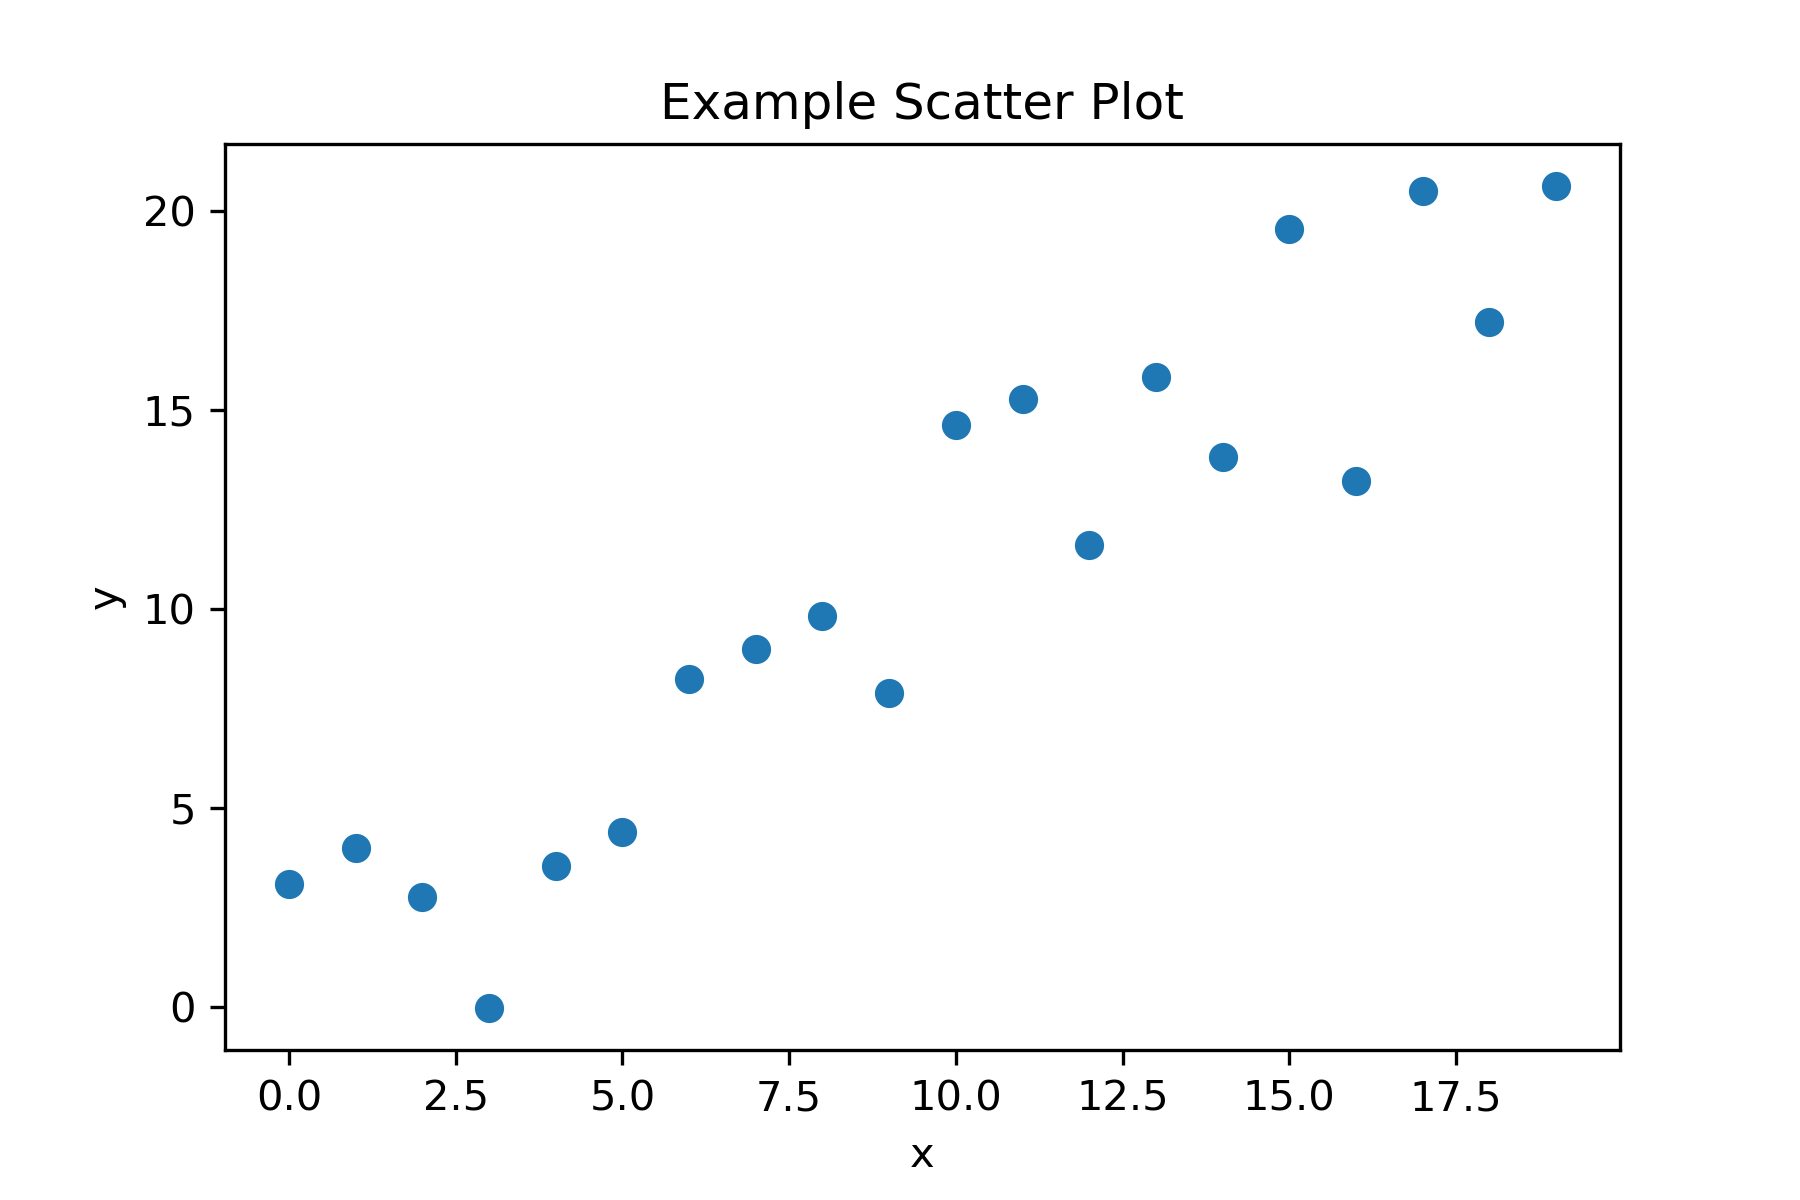
Create a scatter plot
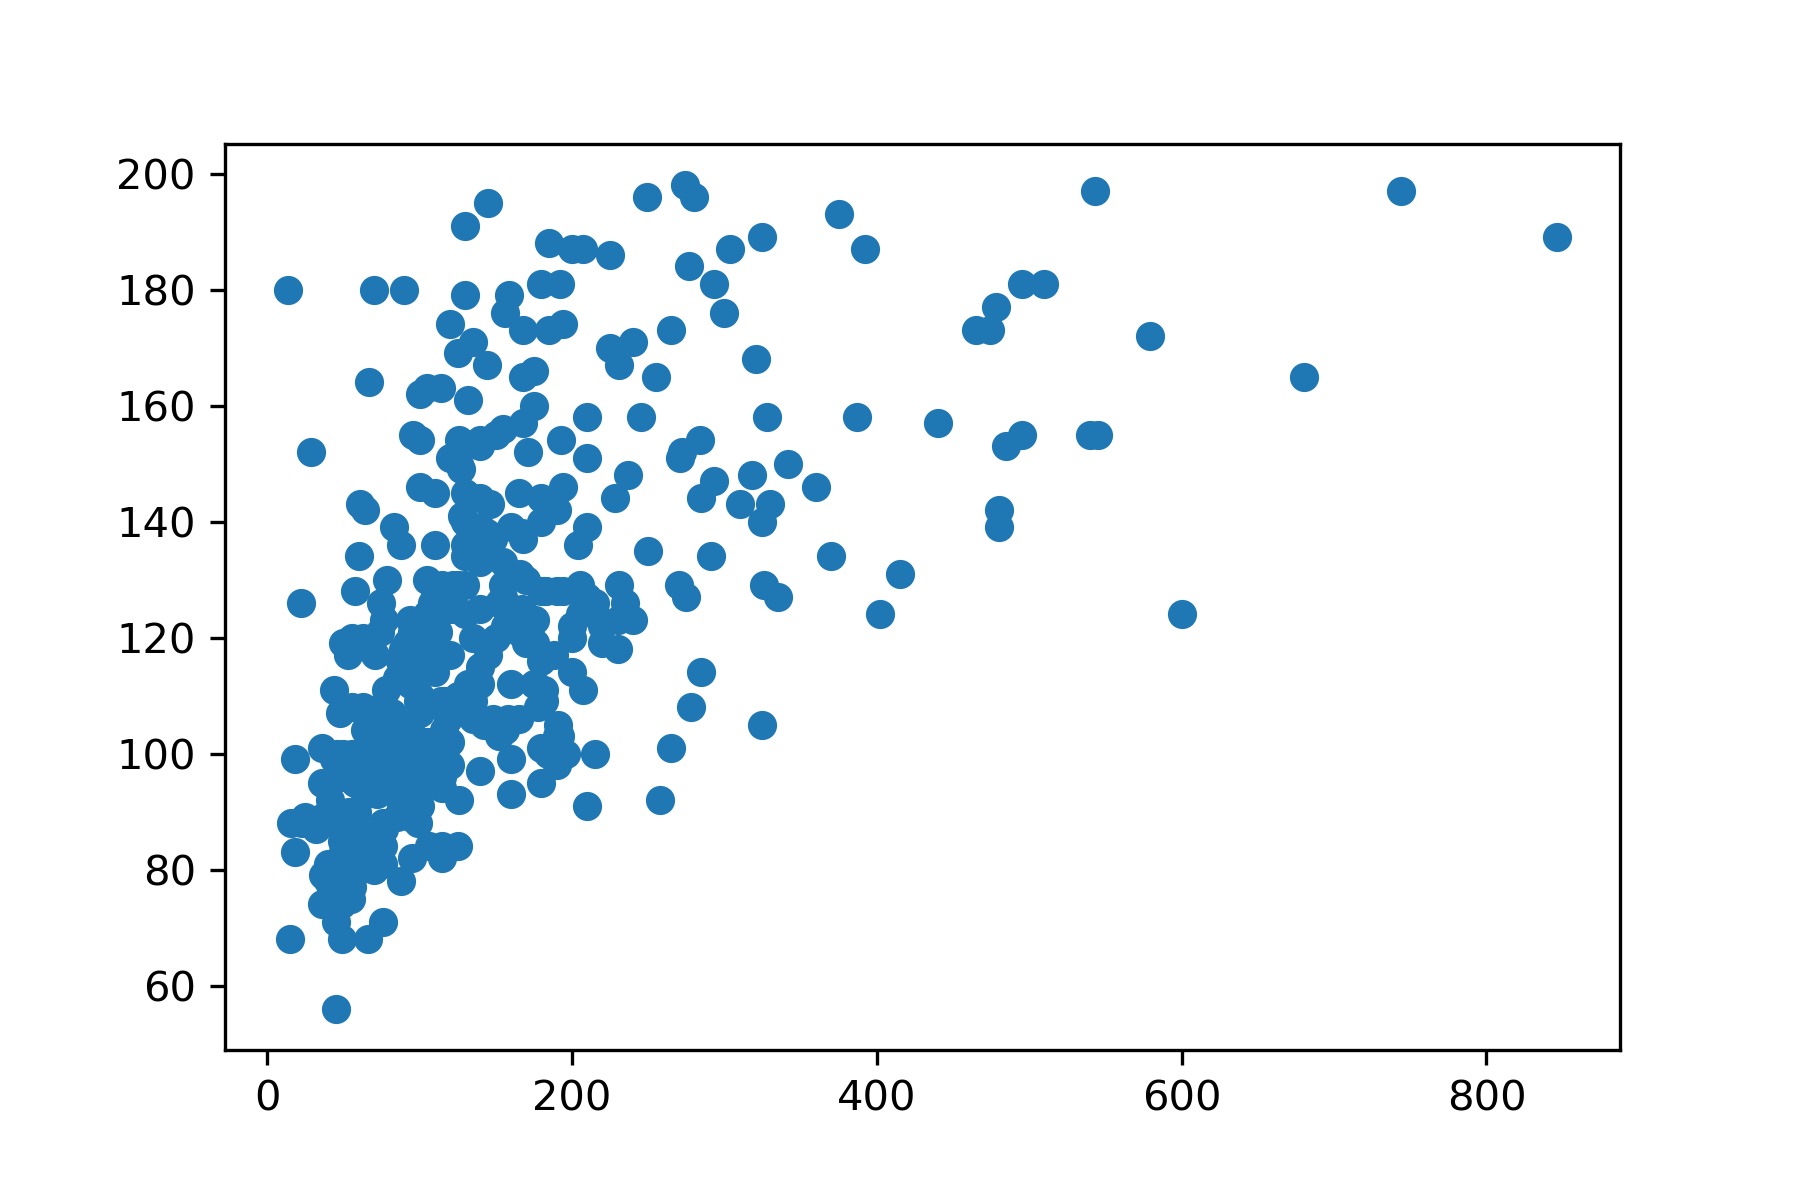
Create a scatter plot
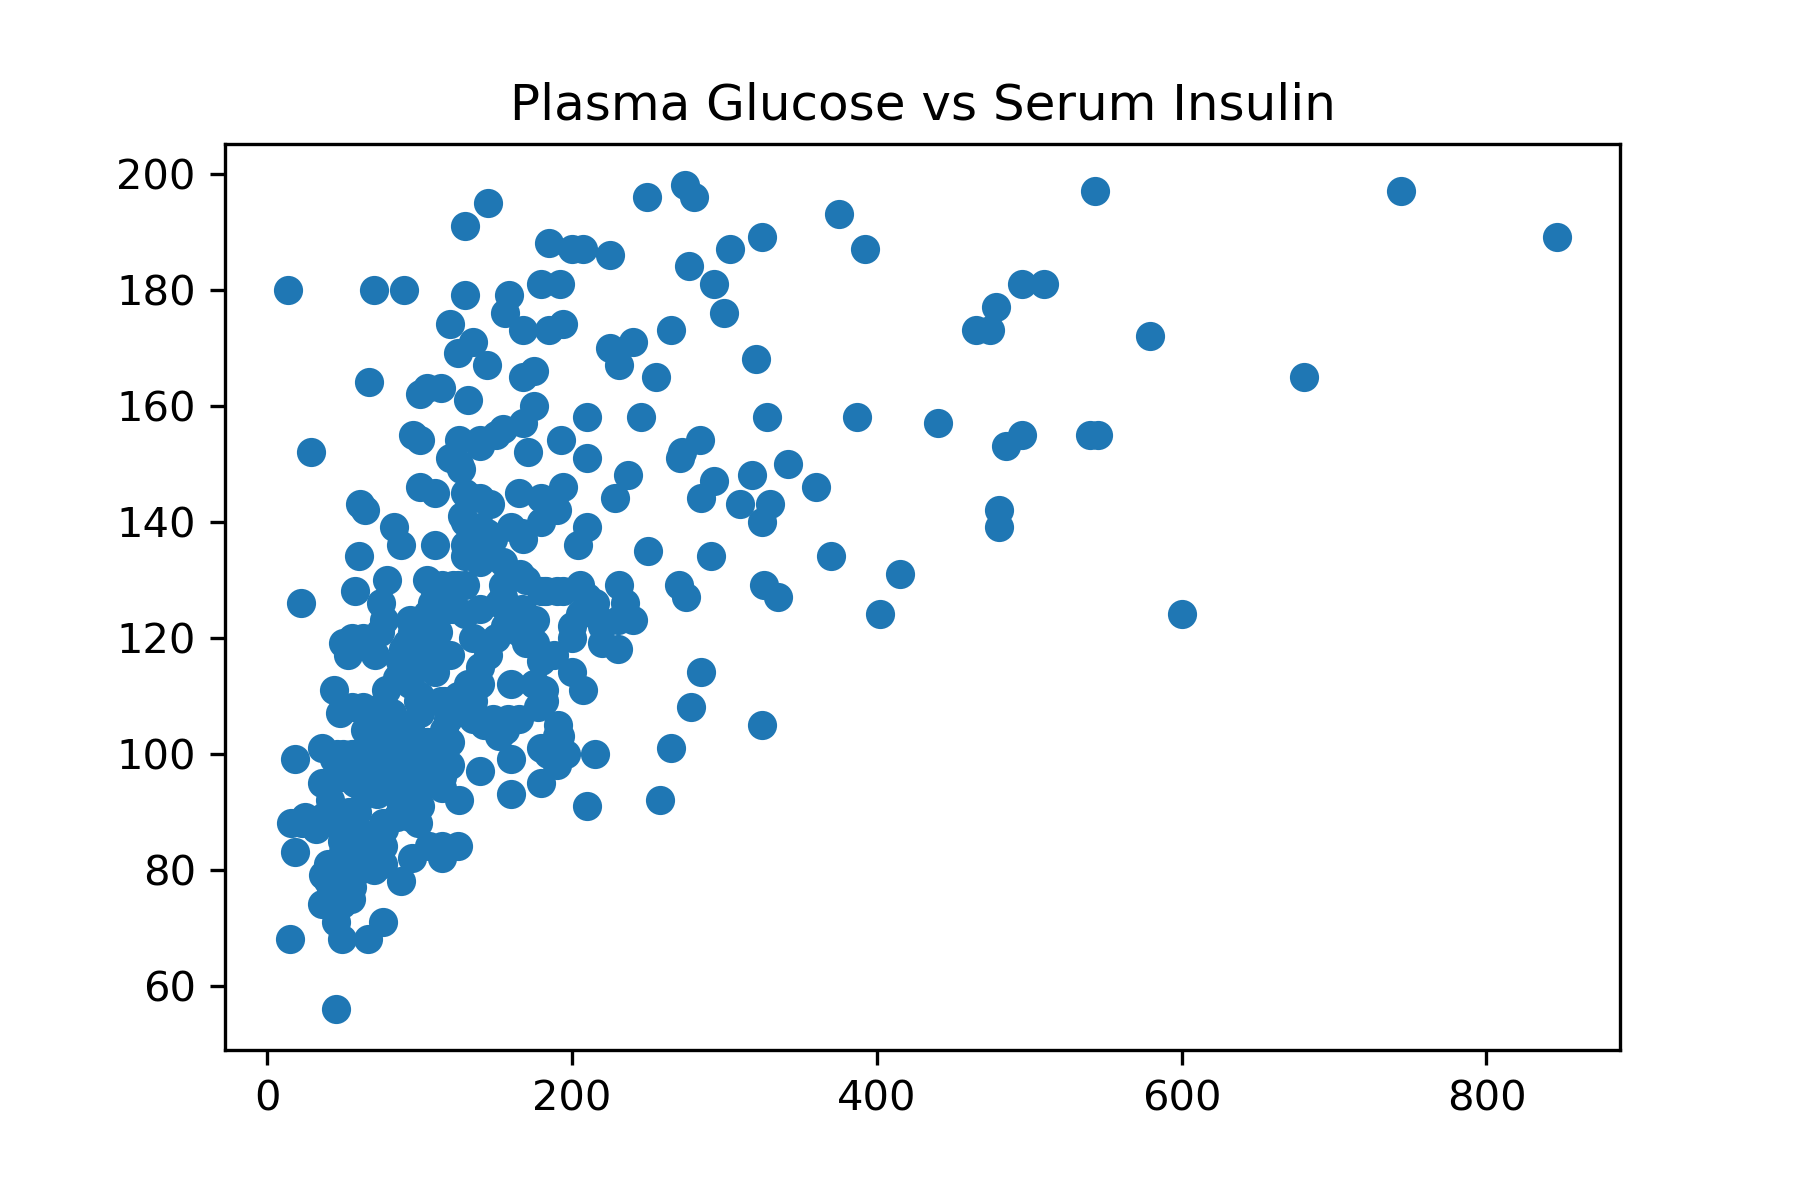
Create a scatter plot
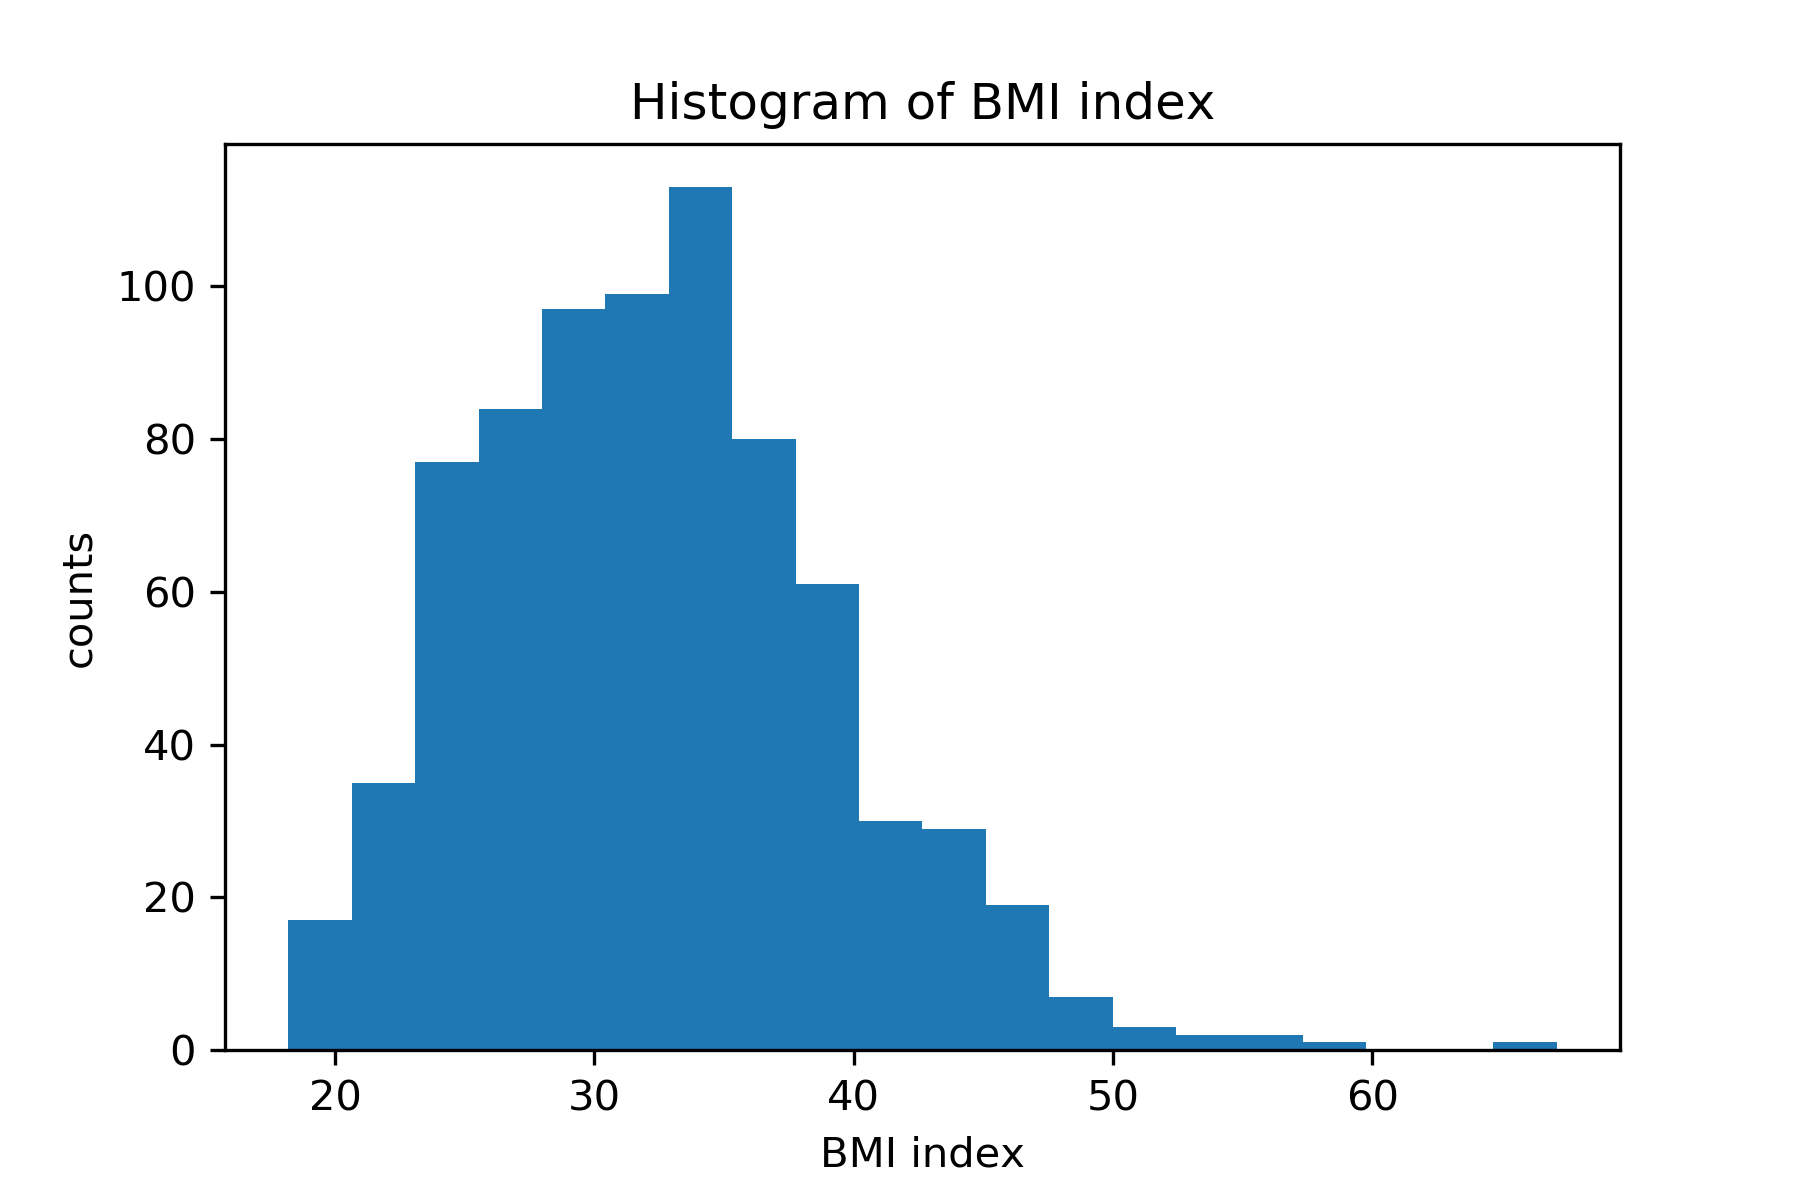
Histogram
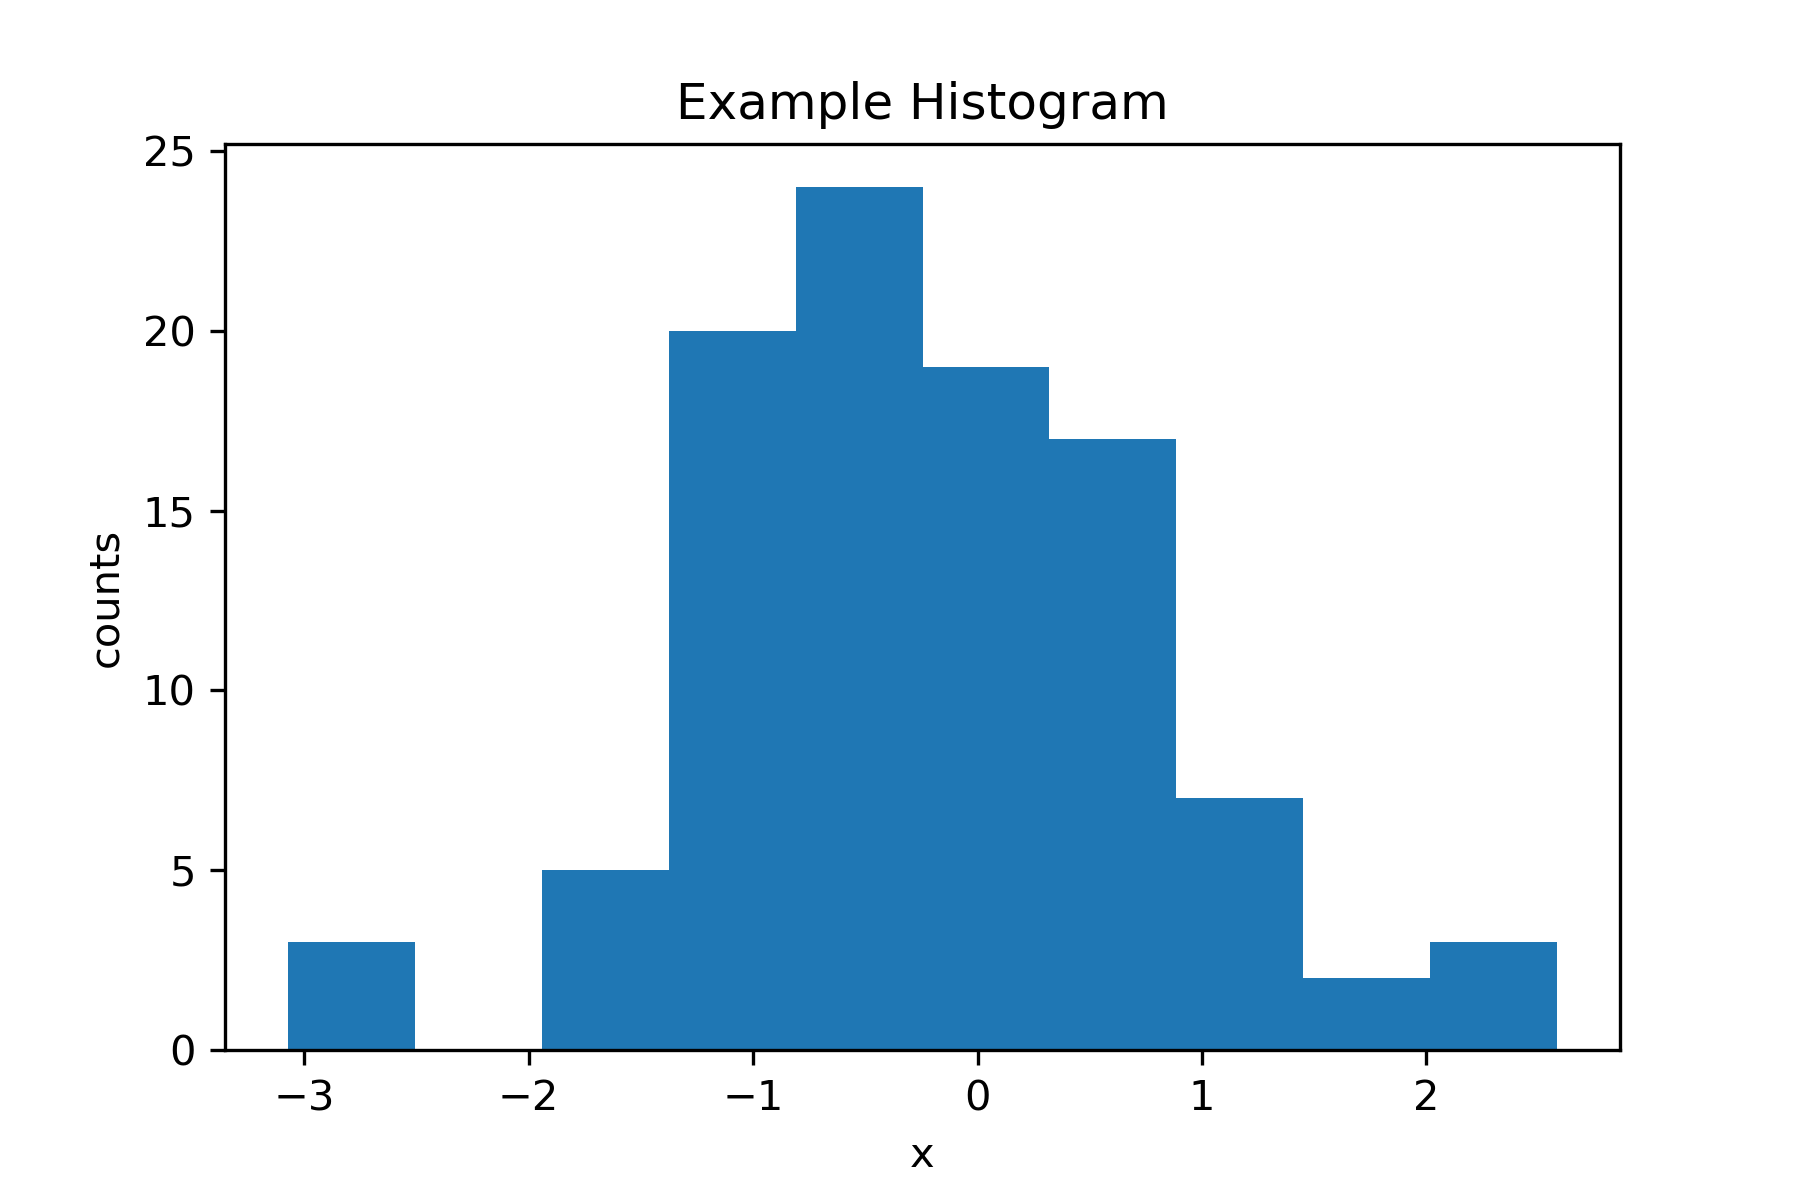
Create a histogram
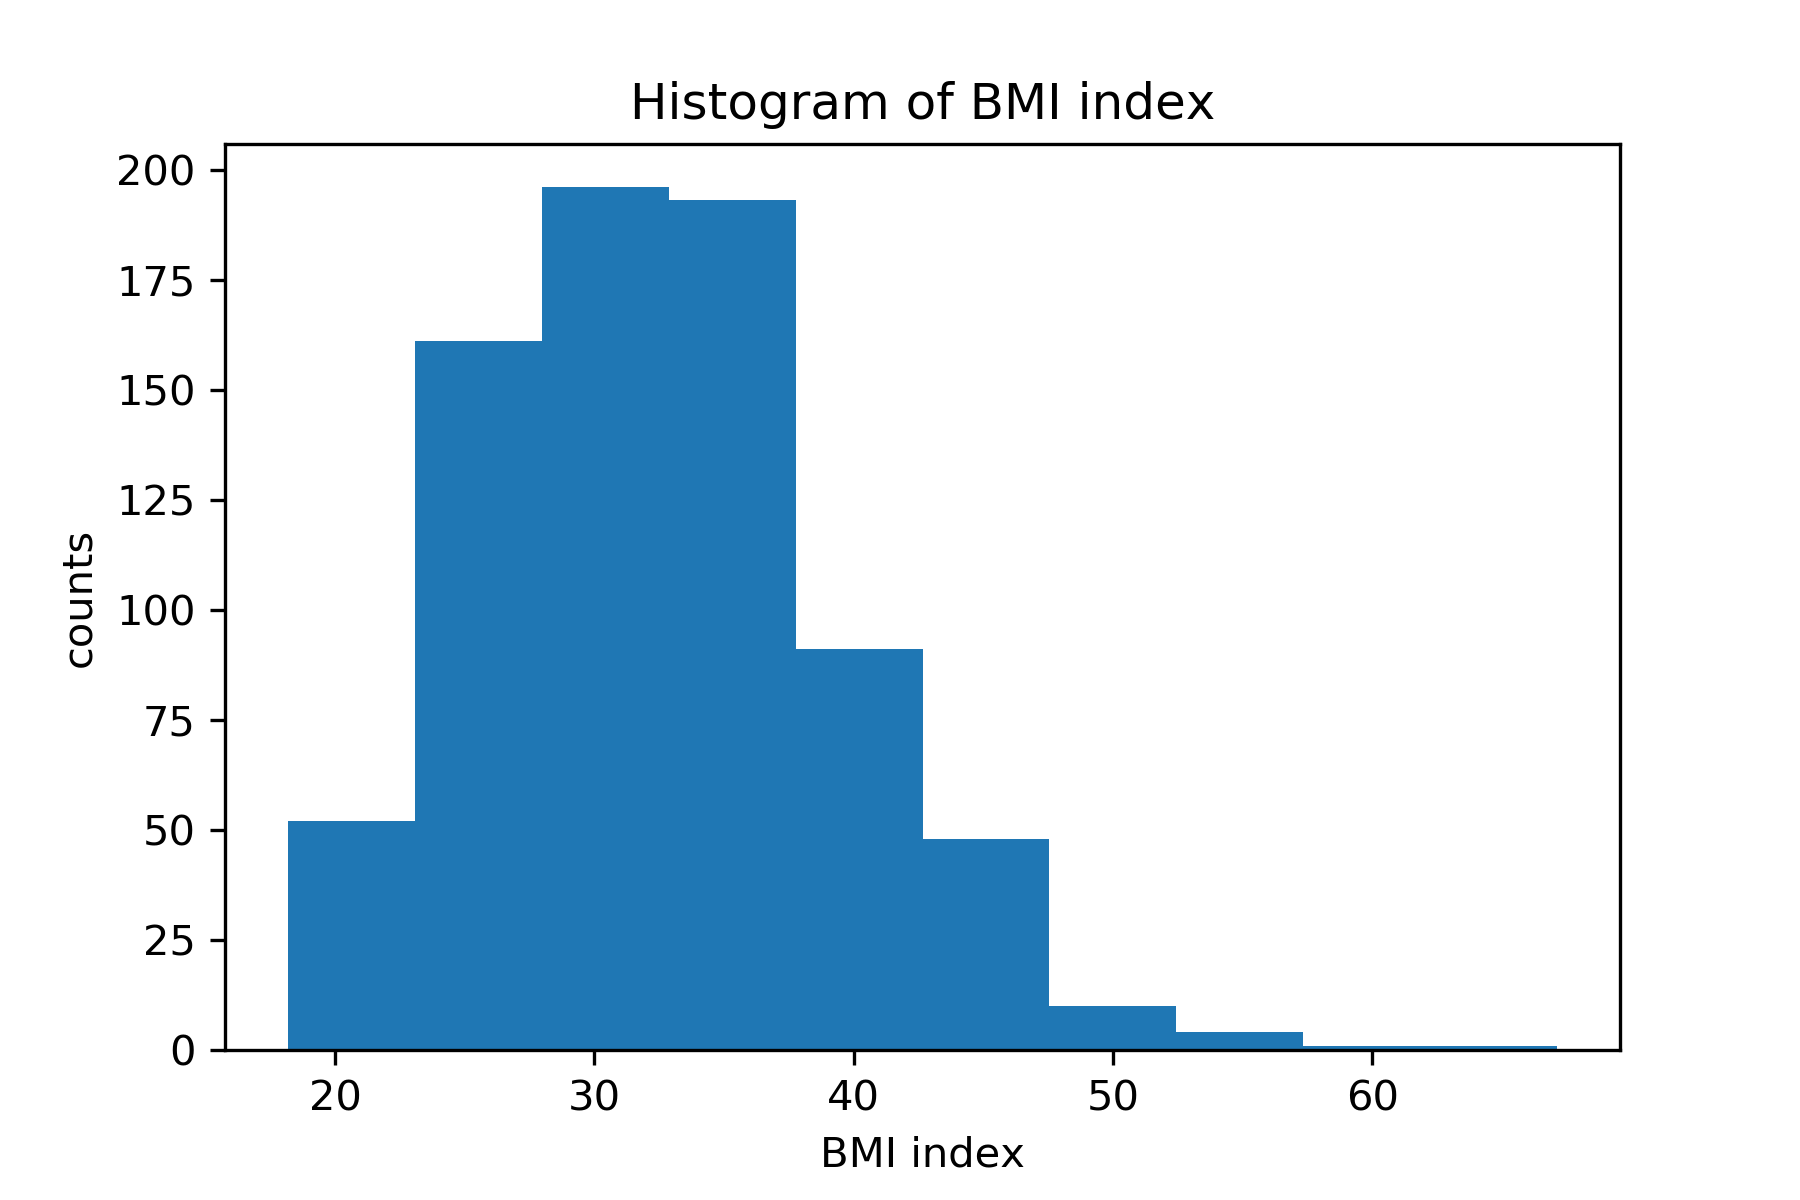
Create a histogram
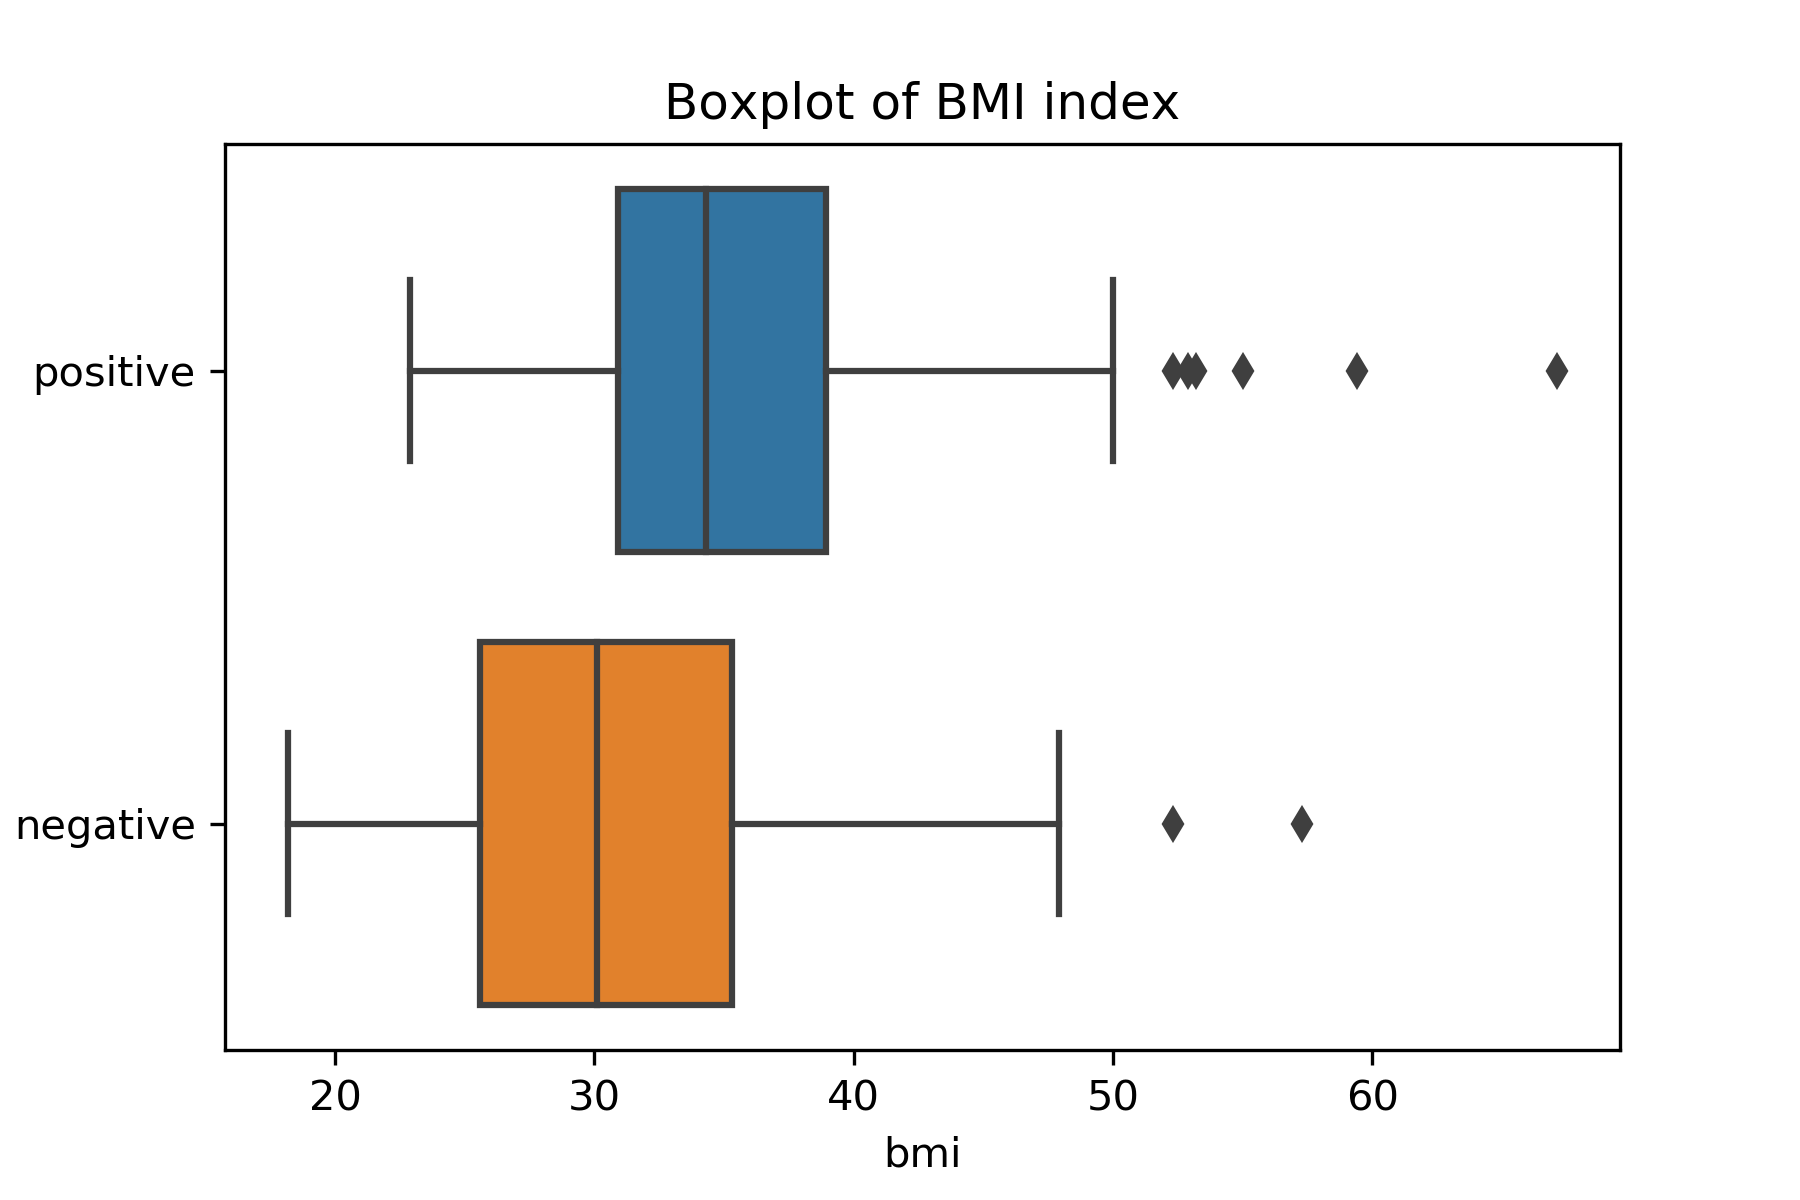
Boxplot
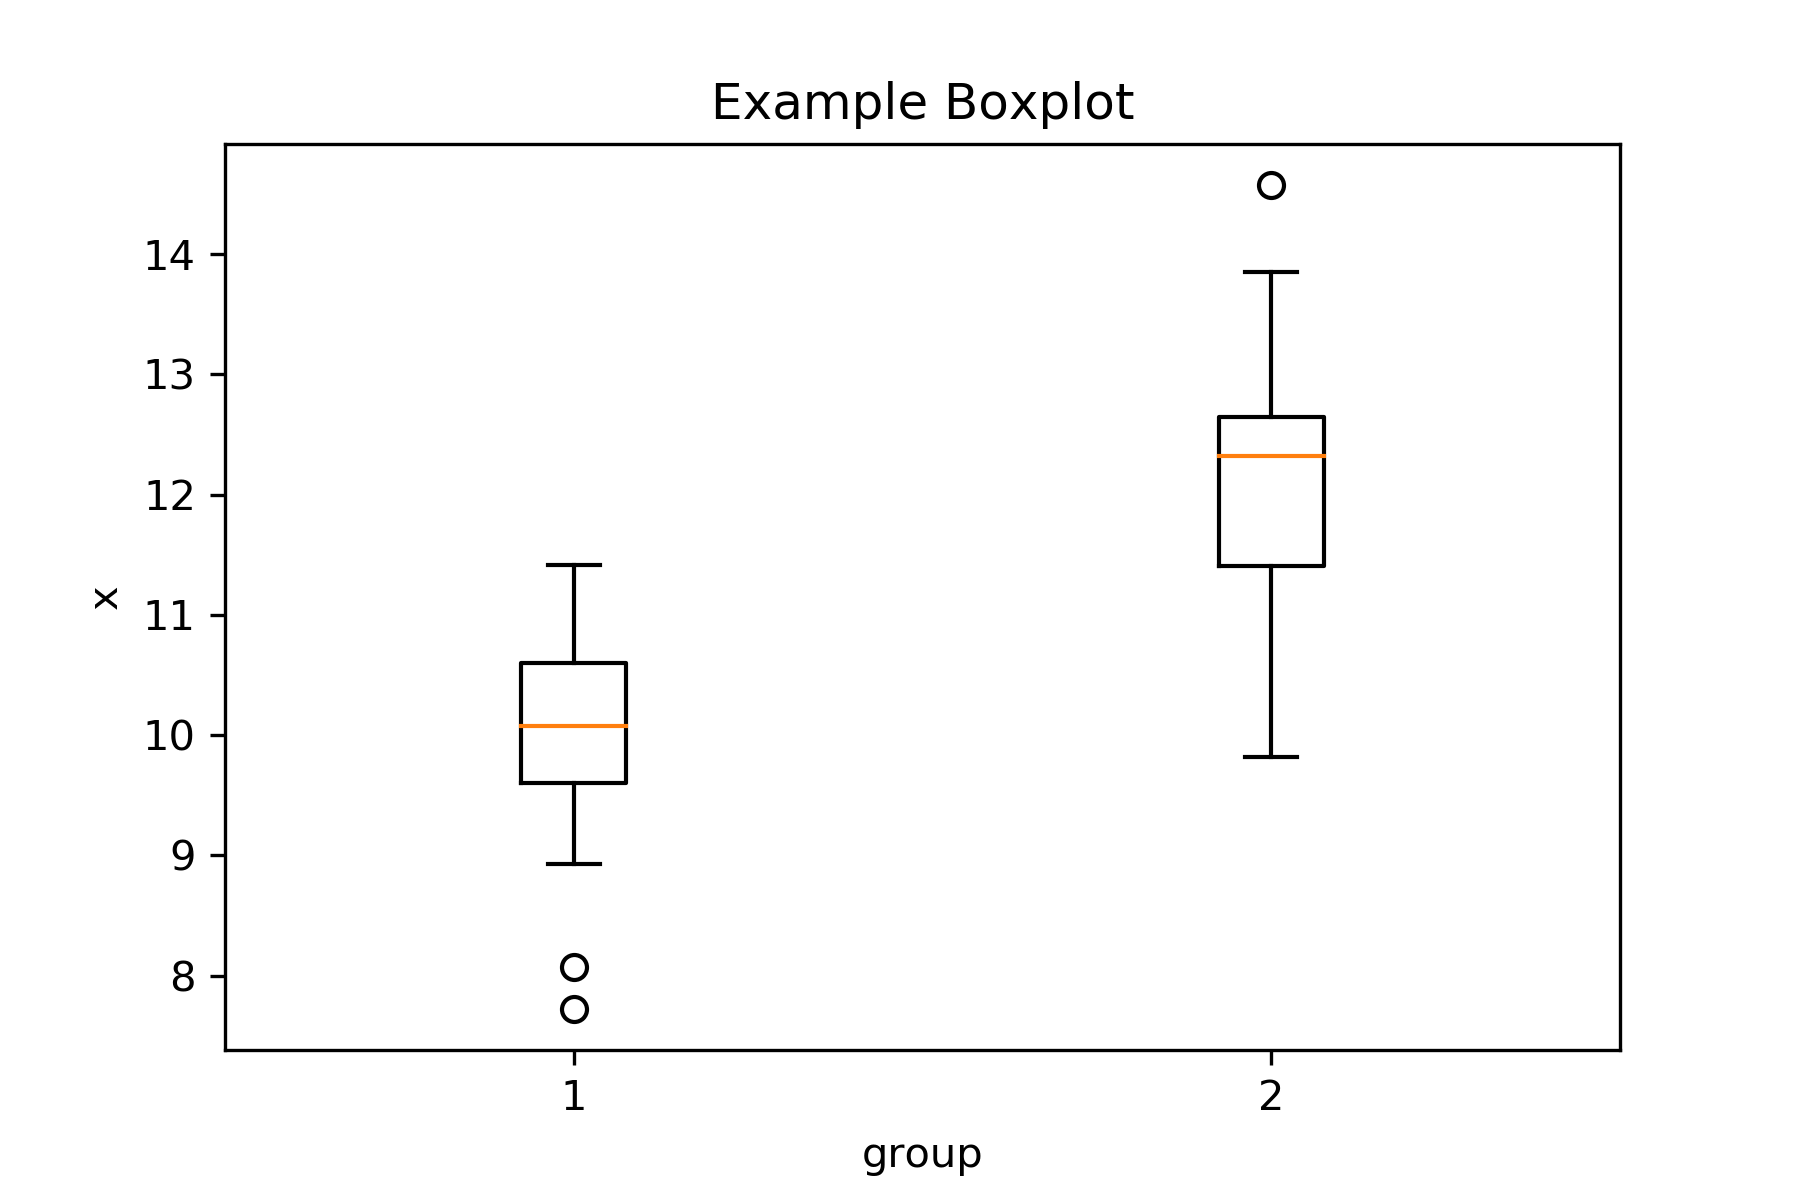
Create a boxplot
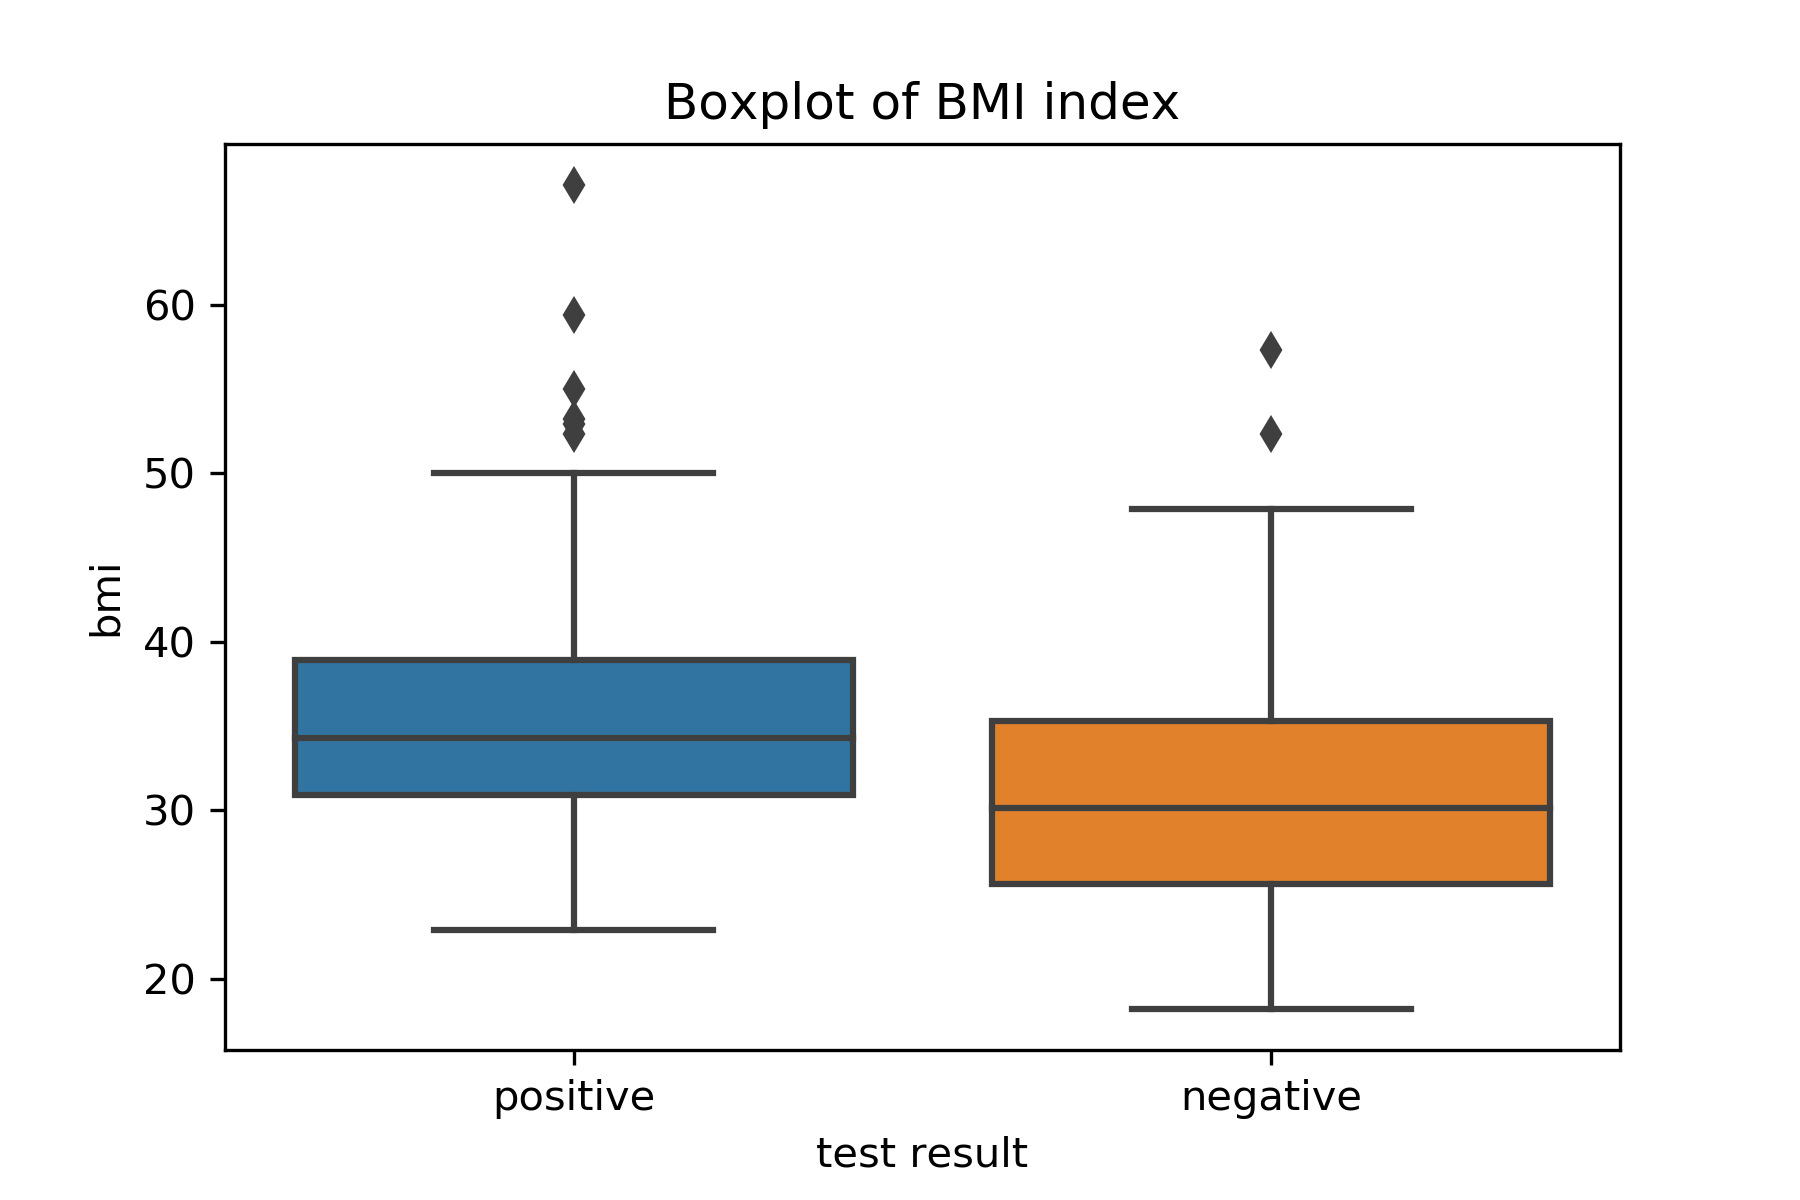
Create a boxplot
Create a boxplot