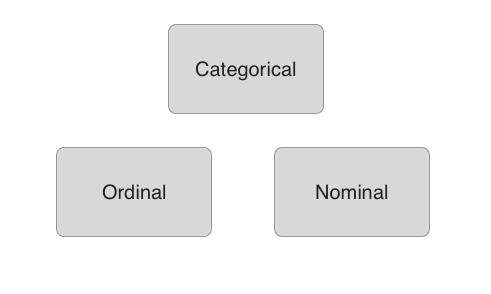
Categorical data
Practicing Statistics Interview Questions in Python

Conor Dewey
Data Scientist, Squarespace
Types of variables
Encoding categorical data
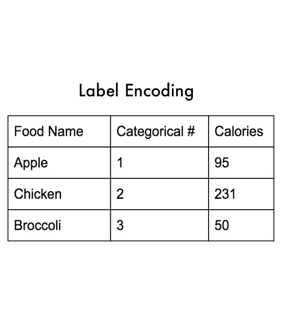
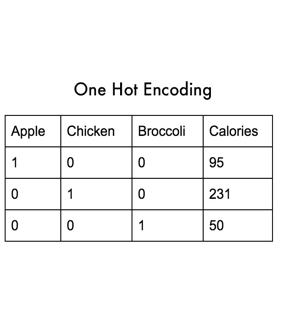
1 What is One Hot Encoding and How to Do It
Example: laptop models
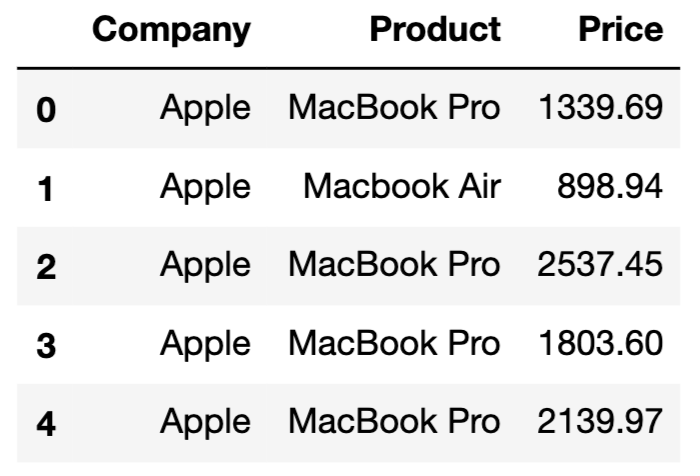
Example: laptop models
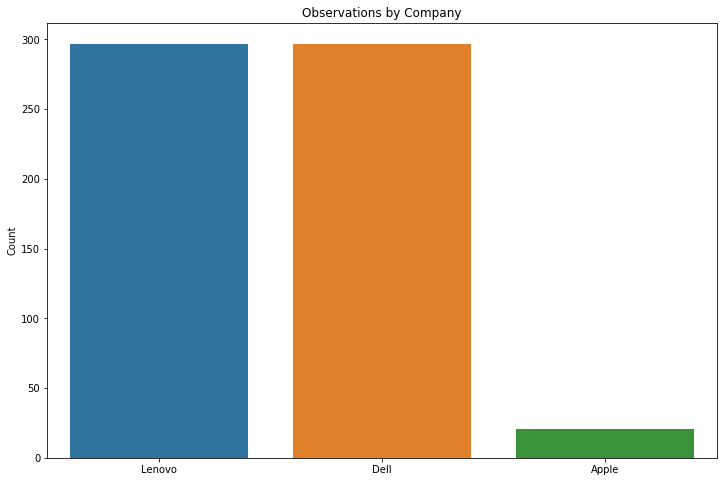
company_count = df['Company'].value_counts()
sns.barplot(company_count.index, company_count.values)
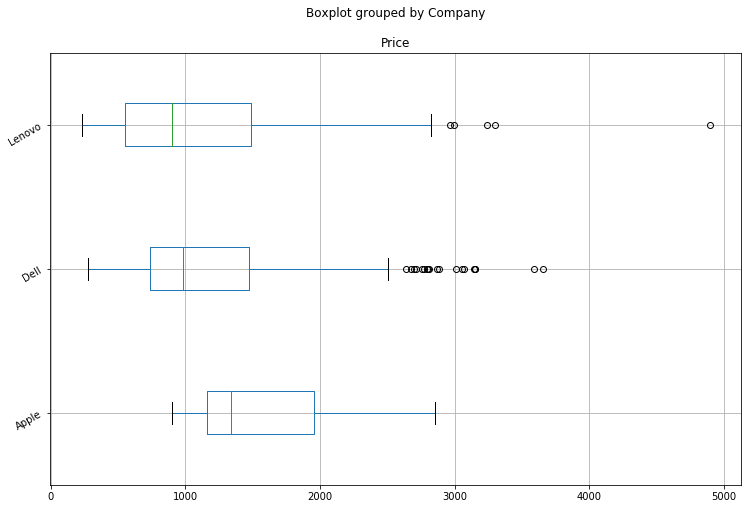
Box plots

1 Wikimedia
Example: laptop models
df.boxplot('Price', 'Company', rot = 30, figsize=(12,8), vert=False)