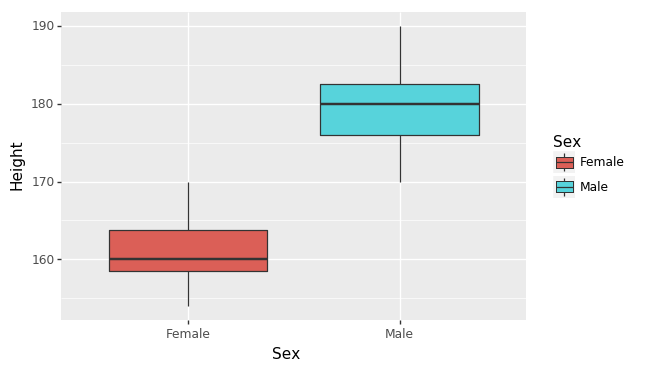
Welcome to the course!

Performing Experiments in Python

Luke Hayden

Instructor

Experimental design

Data

  • Allows us to answer questions

How do we get answers?

  • Need rigorous methods

Approach

  • Build hypotheses with exploratory data analysis
  • Test hypotheses with statistical tests
Performing Experiments in Python

Mapping variables

Variable types

  • Discrete: Finite set of possible values (Ex: True or False)
  • Continuous: Any value (Ex: Measurement)


Mapping

  • X or Y axes
  • Change color with fill or color arguments
Performing Experiments in Python

Making plots with plotnine

  1. Call ggplot() function and give it a DataFrame

  2. Assign mapping of variables with aes()

  3. Specify a geometry

import plotnine as p9

(p9.ggplot([pandas DataFrame])+ 

p9.aes(
    x='variable to put on X-axis',
    y='variable to put on Y-axis', 
    color='variable ')+ 

p9.geom_point()
)

Performing Experiments in Python

Scatter plot

geom_point()

import plotnine as p9
import pandas as pd

df = pd.DataFrame(data= {'Sex': ["Male", "Male", "Female","Female"] ,
                         "Height (cm)": [183, 179, 160, 172], 
                         "Weight (kg)": [82,75.1,  50, 58.7]})

print(p9.ggplot(df)+ p9.aes(x='Height (cm)',y='Weight (kg)', color='Sex')+ p9.geom_point())

Performing Experiments in Python

Simple scatter plot of height and weight of sample people

Performing Experiments in Python

Boxplot

geom_boxplot()


import plotnine as p9
import pandas as pd

df = pd.DataFrame(data= {'Sex': ["Male", "Male","Male", "Male","Male", "Male", 
"Female","Female", "Female","Female", "Female","Female"] ,
                         "Height": [183, 179, 190, 181, 170, 175, 
                         160, 165, 158, 154, 170, 160]})

(p9.ggplot(df)+ p9.aes(x='Sex',y='Height', fill='Sex')+ p9.geom_boxplot())
Performing Experiments in Python

Simple boxplot of height of females vs males

Performing Experiments in Python

Density plot

geom_density()

import plotnine as p9
import pandas as pd
df = pd.DataFrame(data= {'Sex': ["Male", "Male","Male", "Male","Male", "Male", 
"Female","Female", "Female","Female", "Female","Female"] ,
                         "Height": [183, 179, 190, 181, 170, 175, 
                         160, 165, 158, 154, 170, 160]})
(p9.ggplot(df)+ p9.aes(x='Height', fill='Sex') + p9.geom_density(alpha=0.5))
Performing Experiments in Python

Density plot of male versus female height

Performing Experiments in Python

Let's practice!

Performing Experiments in Python

Preparing Video For Download...