Performing Experiments in Python
Luke Hayden
Instructor
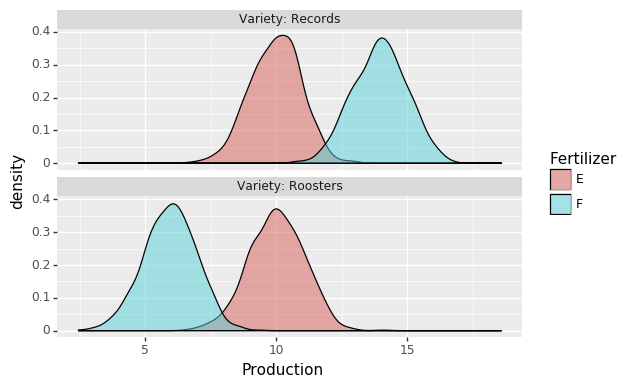
In this example:
Fertilizer E is best for Roosters
Fertilizer F is best for Records
import statsmodels as sm
formula = 'Production ~ Fertilizer + Variety + Fertilizer:Variety'
model = sm.api.formula.ols(formula, data=df).fit()
aov_table = sm.api.stats.anova_lm(model, typ=2)
print(aov_table)
                          sum_sq      df             F  PR(>F)
Fertilizer                           1.0                   p-value
Variety                              1.0                   p-value
Fertilizer:Variety                   1.0                   p-value
Residual                                           NaN     NaN
                          sum_sq      df             F  PR(>F)
Fertilizer          56425.833205     1.0  60222.992593     0.0
Variety             56049.056459     1.0  59820.860770     0.0
Fertilizer:Variety  55385.556078     1.0  59112.710332     0.0
Residual             3744.045584  3996.0           NaN     NaN
                          sum_sq      df             F    PR(>F)
Fertilizer          15468.395105     1.0  15172.001139  0.000000
Variety             16010.275045     1.0  15703.497977  0.000000
Fertilizer:Variety      1.464654     1.0      1.436589  0.230763
Residual             4074.064210  3996.0           NaN       NaN
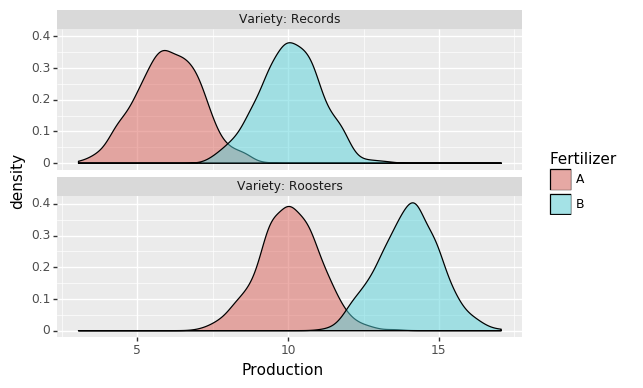
Two-way ANOVA
formula = 'Production ~
Fertilizer + Variety + Fertilizer:Variety'
Three-way ANOVA
formula = 'Production ~ Fertilizer +
Variety + Season + Fertilizer:Variety +
Fertilizer:Season + Variety:Season +
Fertilizer:Variety:Season'