Our first hypothesis test - Student's t-test
Performing Experiments in Python

Luke Hayden
Instructor
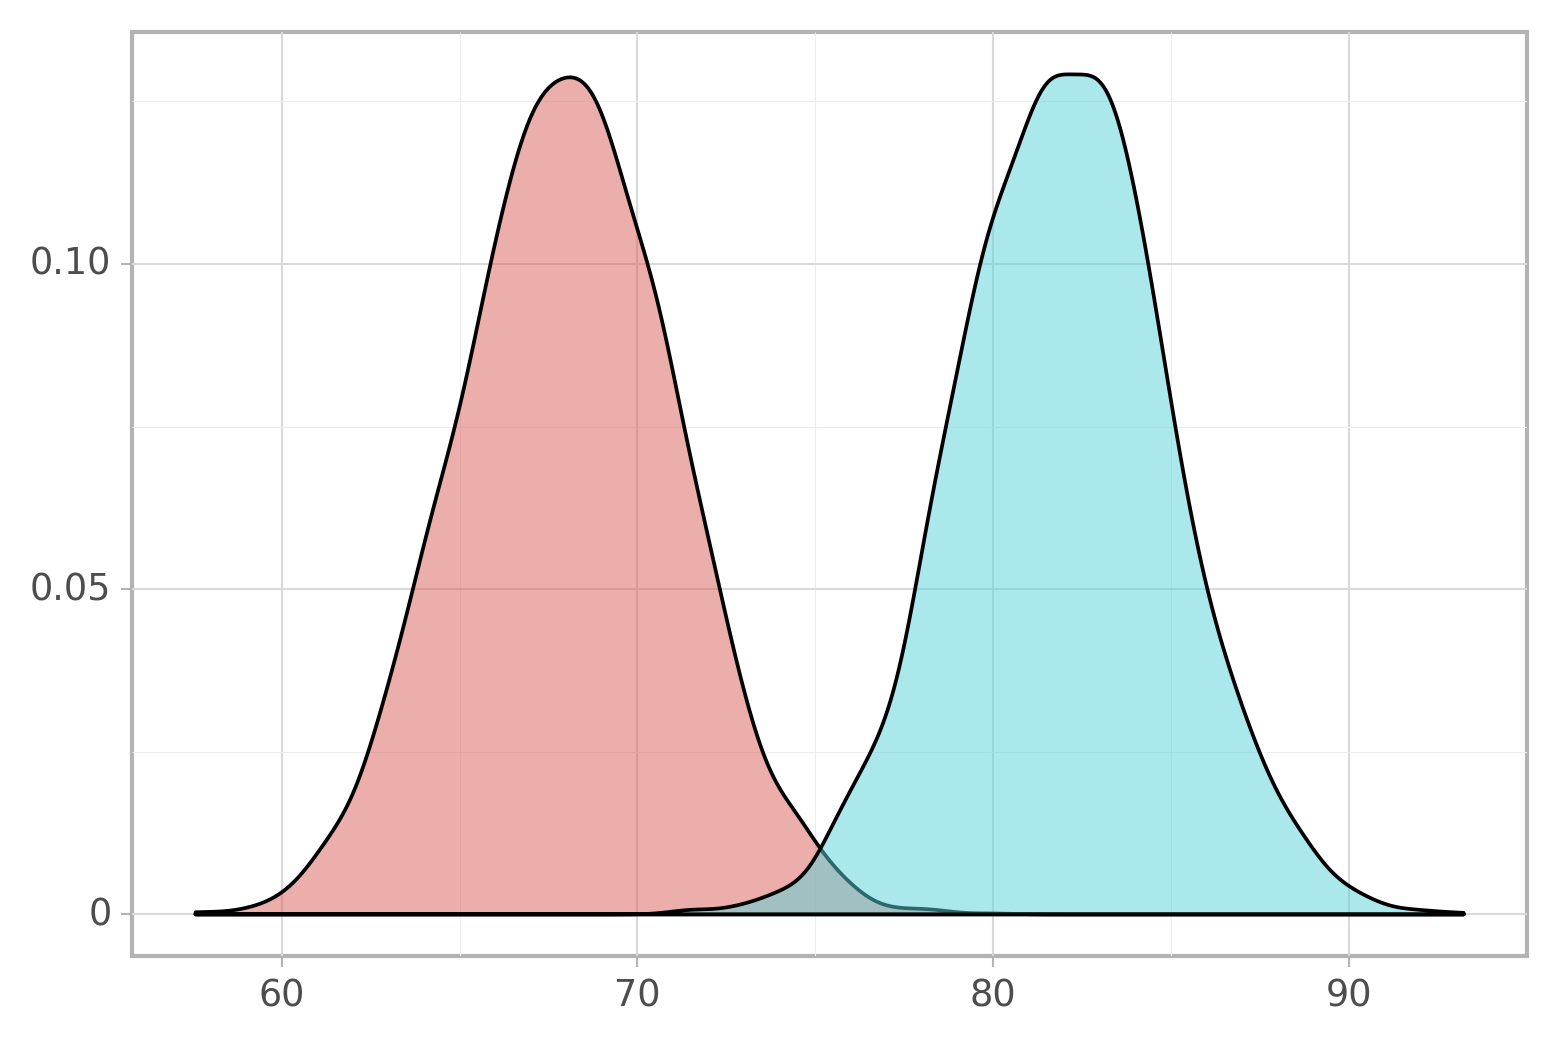
Are these groups different?
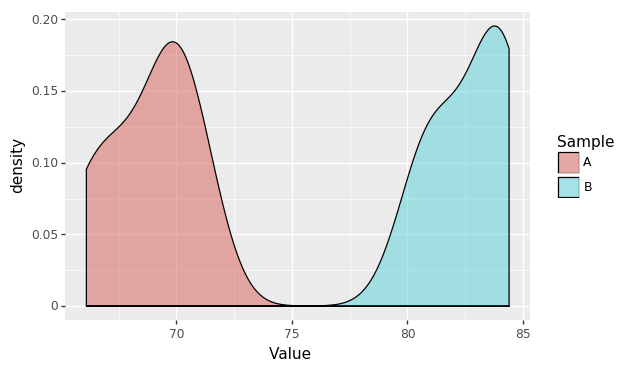
(p9.ggplot(df)+
p9.aes('Value', fill='Sample')+
p9.geom_density(alpha=0.5))
Are these different?
Two hypotheses