Assumptions and normal distributions
Performing Experiments in Python

Luke Hayden
Instructor
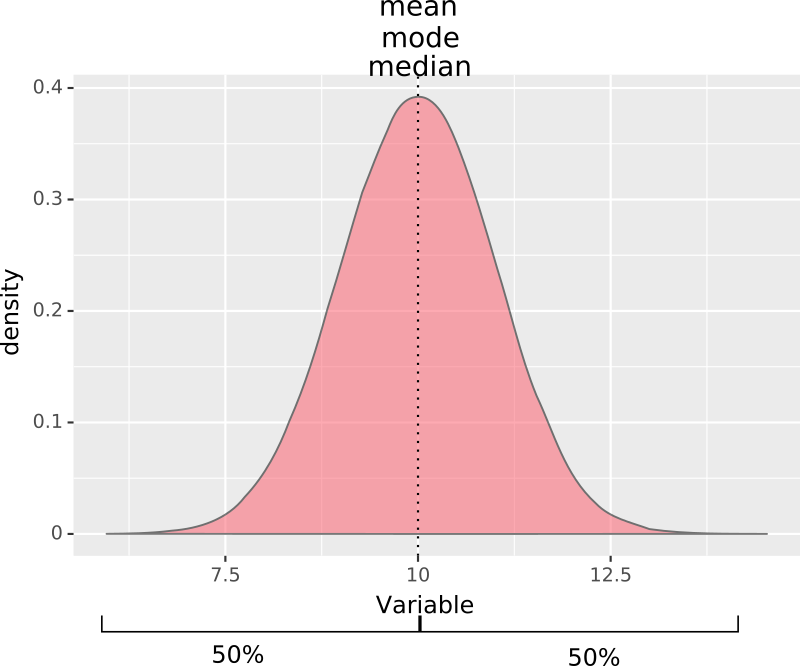
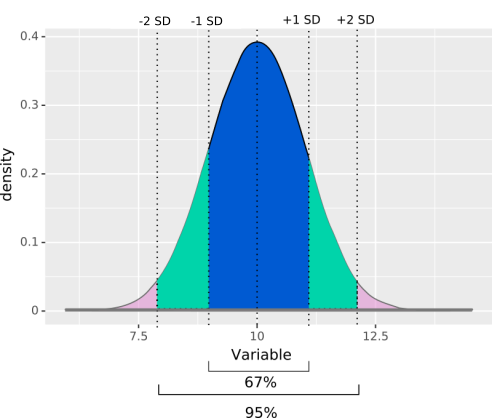
Normal distribution
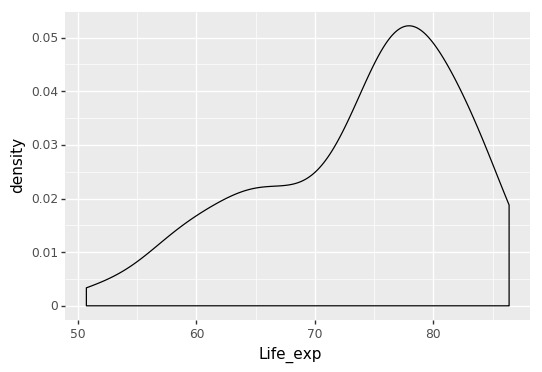
Sample distribution
print(p9.ggplot(countrydata)+ p9.aes(x= 'Life_exp')+ p9.geom_density(alpha=0.5))
Normal distribution
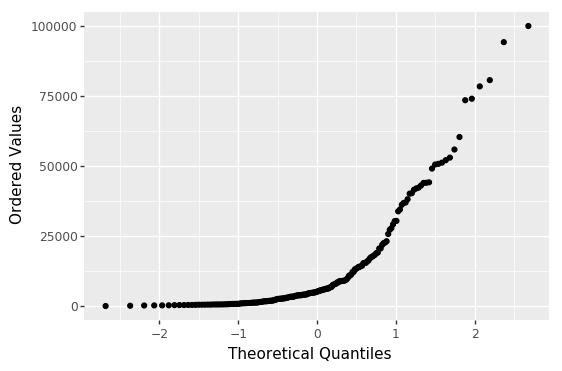
Q-Q (quantile-quantile) plot
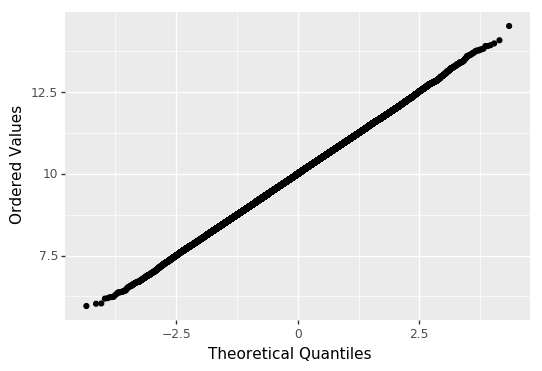
Q-Q plot for sample
Distribution
Q-Q plot