Loan visualizations
Loan Amortization in Google Sheets

Brent Allen
Instructor
Available visualizations
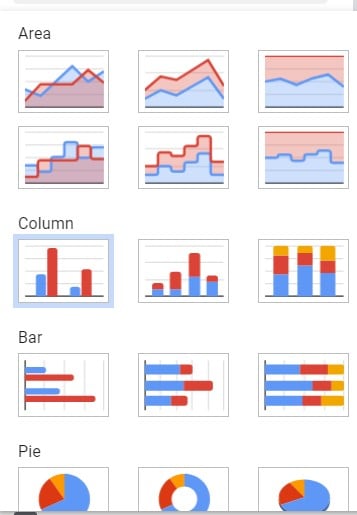
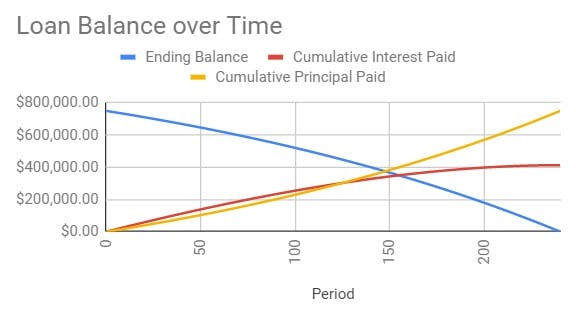
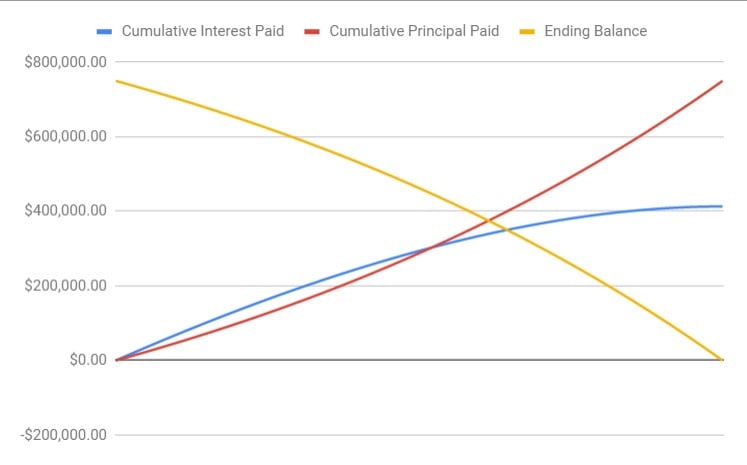
Line graphs
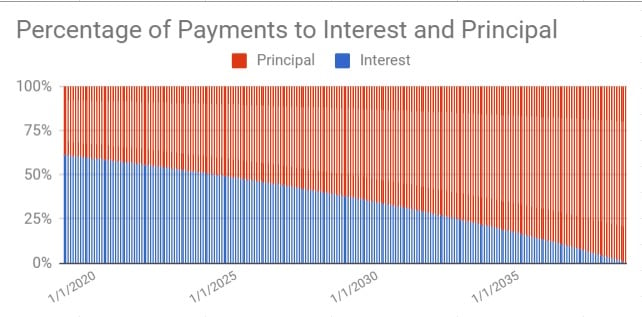
Stacked column charts
Creating a visualization box
![]()
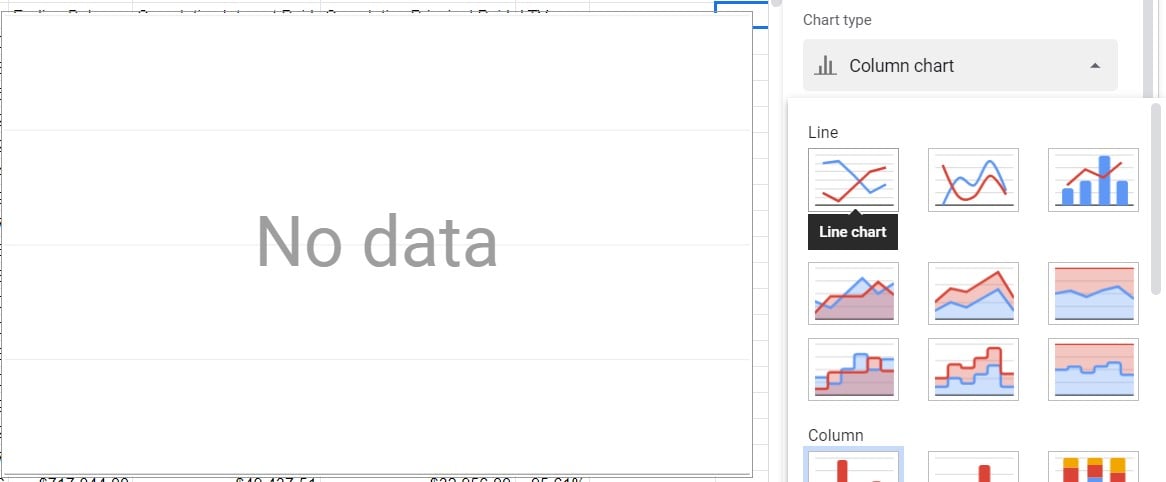
Adding data
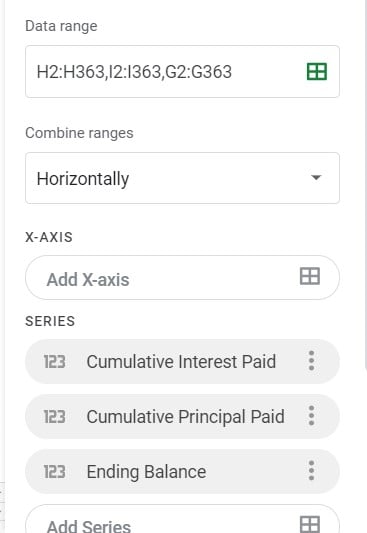
Missing elements
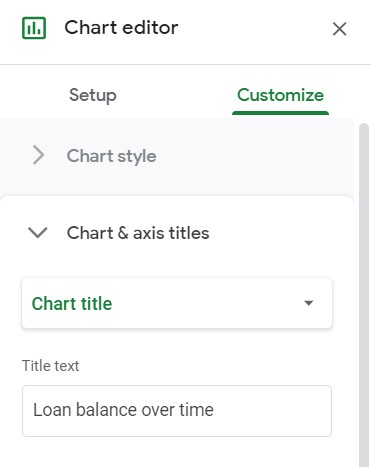
Adding titles
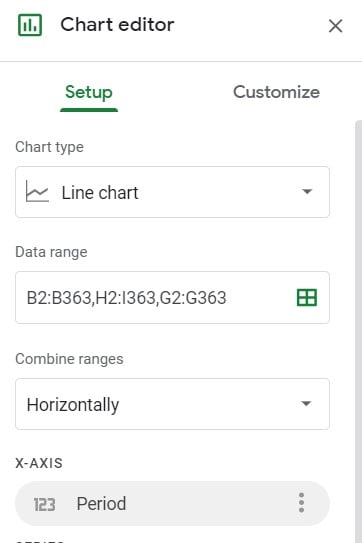
Adding the X axis
Loan Amortization in Google Sheets
Brent Allen
Instructor
![]()

