Intro to ACF and PACF
ARIMA Models in Python

James Fulton
Climate informatics researcher
Motivation
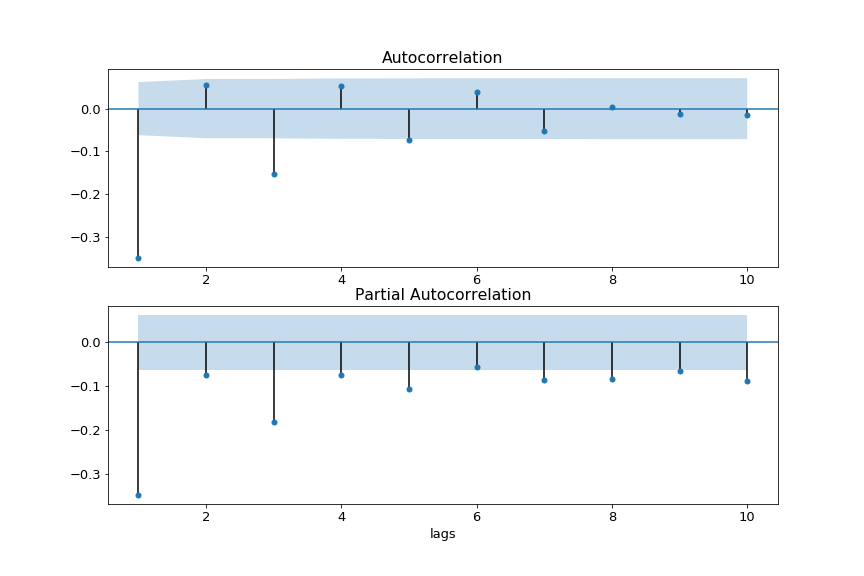
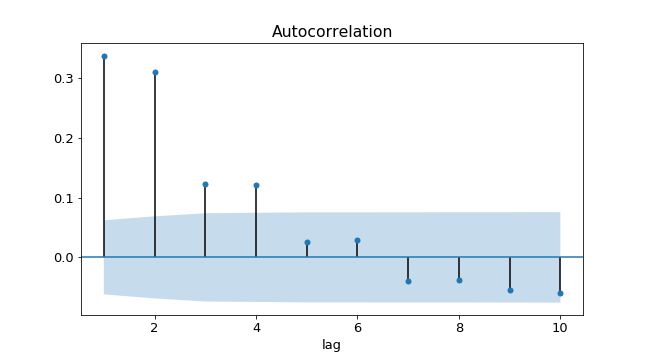
What is the ACF
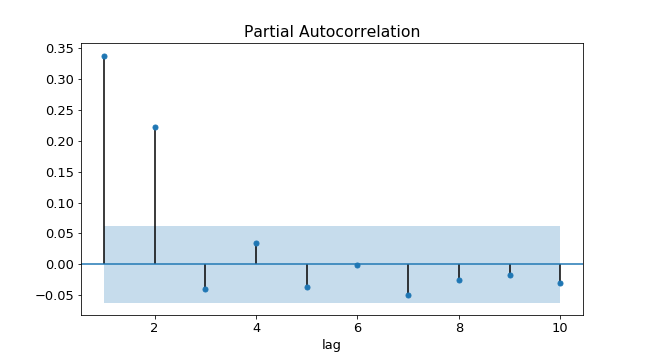
What is the PACF
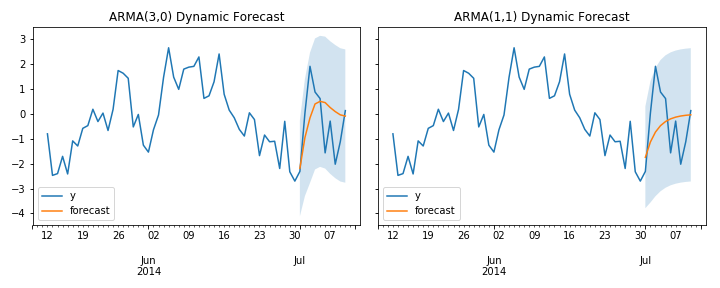
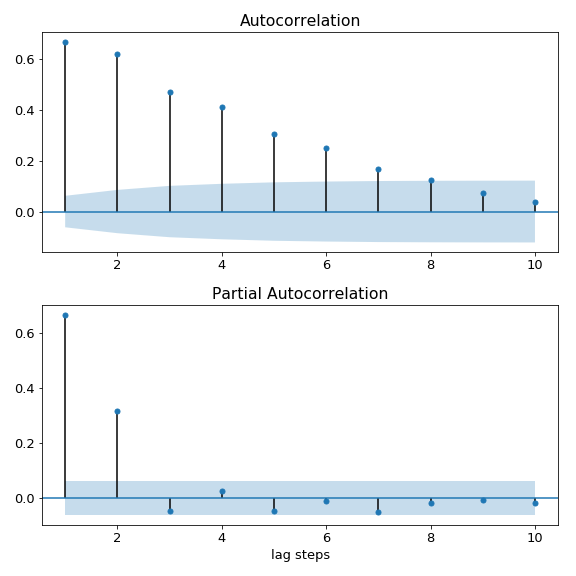
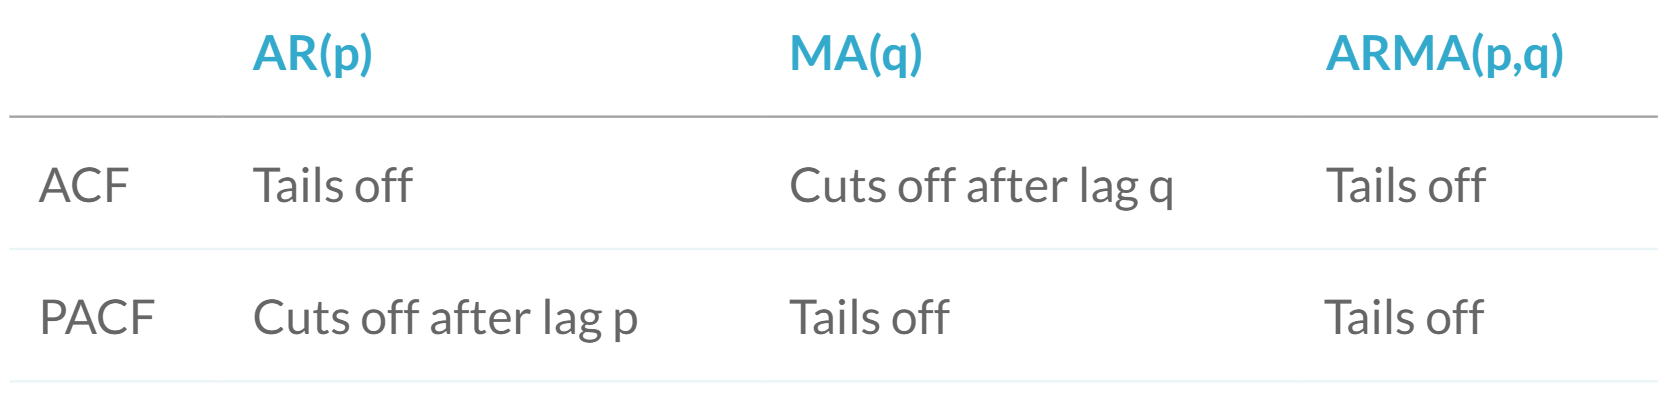
Using ACF and PACF to choose model order
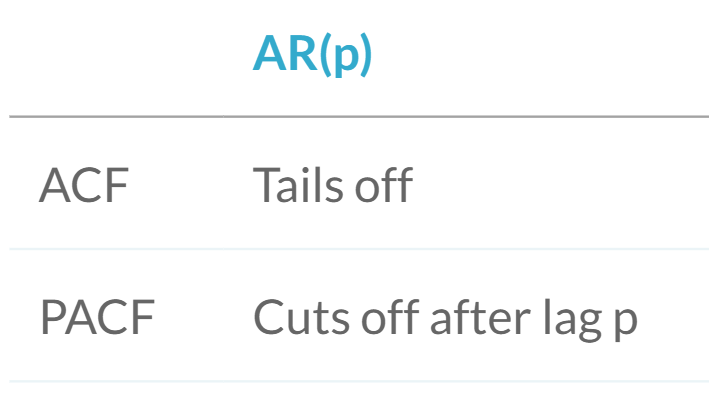
- AR(2) model $\rightarrow$
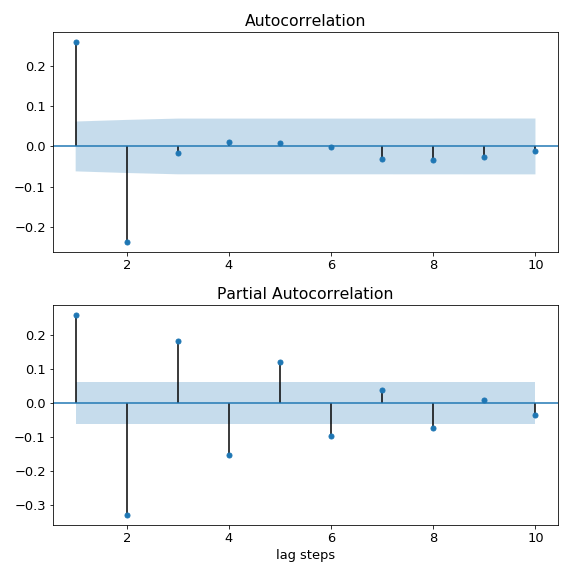
Using ACF and PACF to choose model order
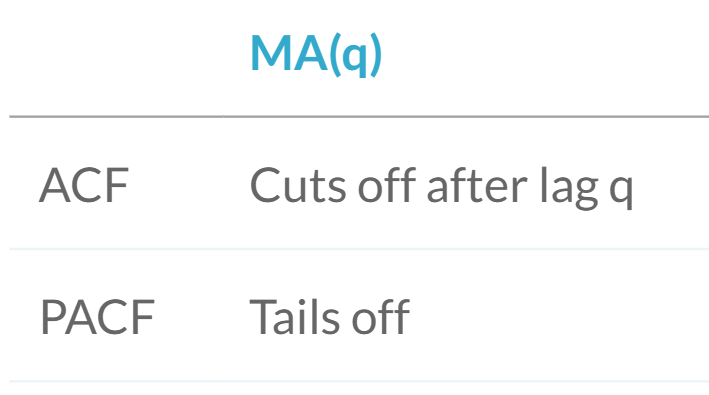
- MA(2) model $\rightarrow$
Using ACF and PACF to choose model order
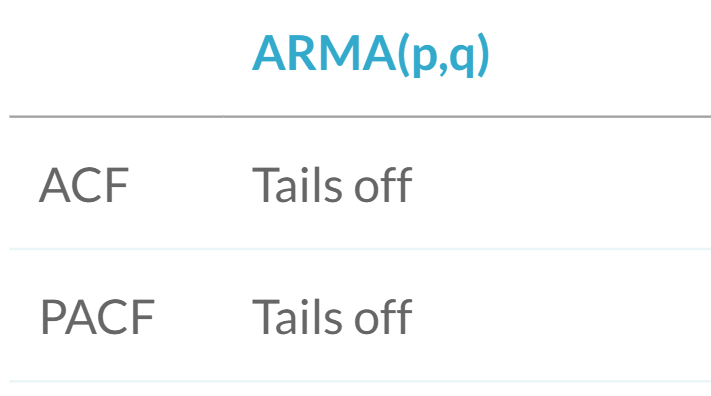
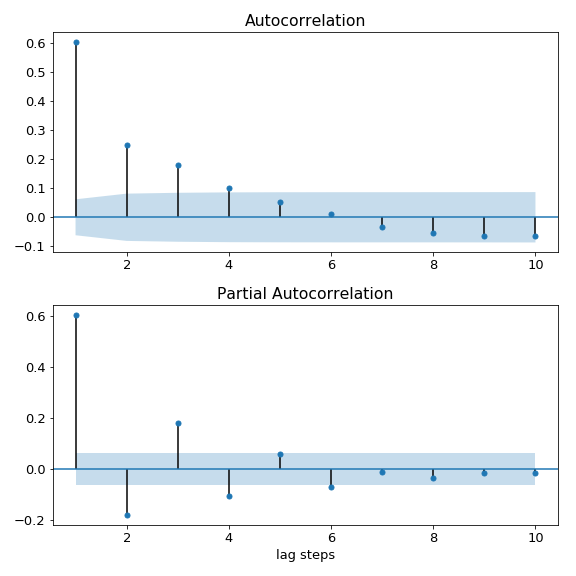
Using ACF and PACF to choose model order
Implementation in Python
Over/under differencing and ACF and PACF
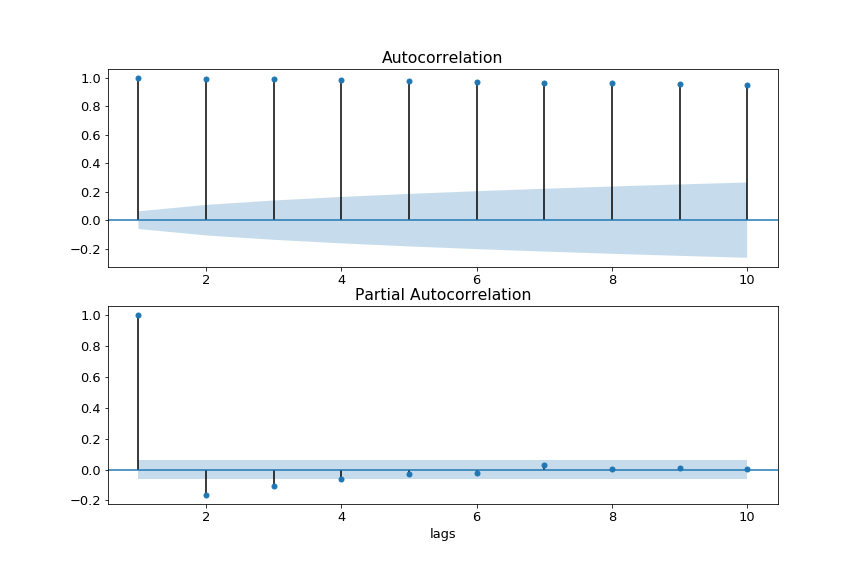
Over/under differencing and ACF and PACF