Statistic, proportion of successes in sample → $\hat{p}$
Parameter, proportion of successes in population → ${p}$
Confidence intervals
No null population, unlike in hypothesis testing
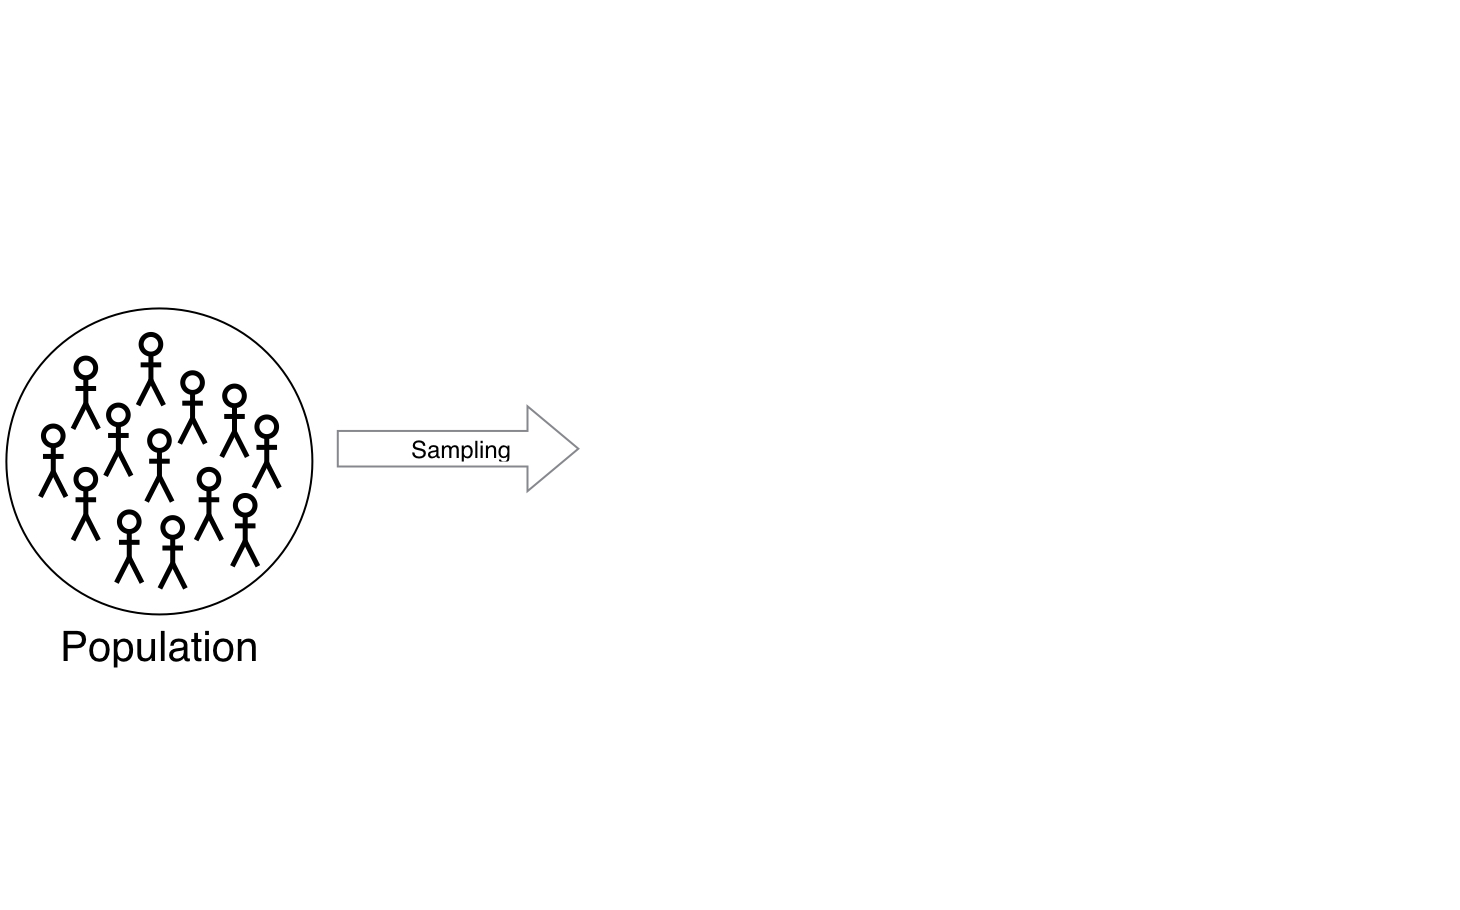
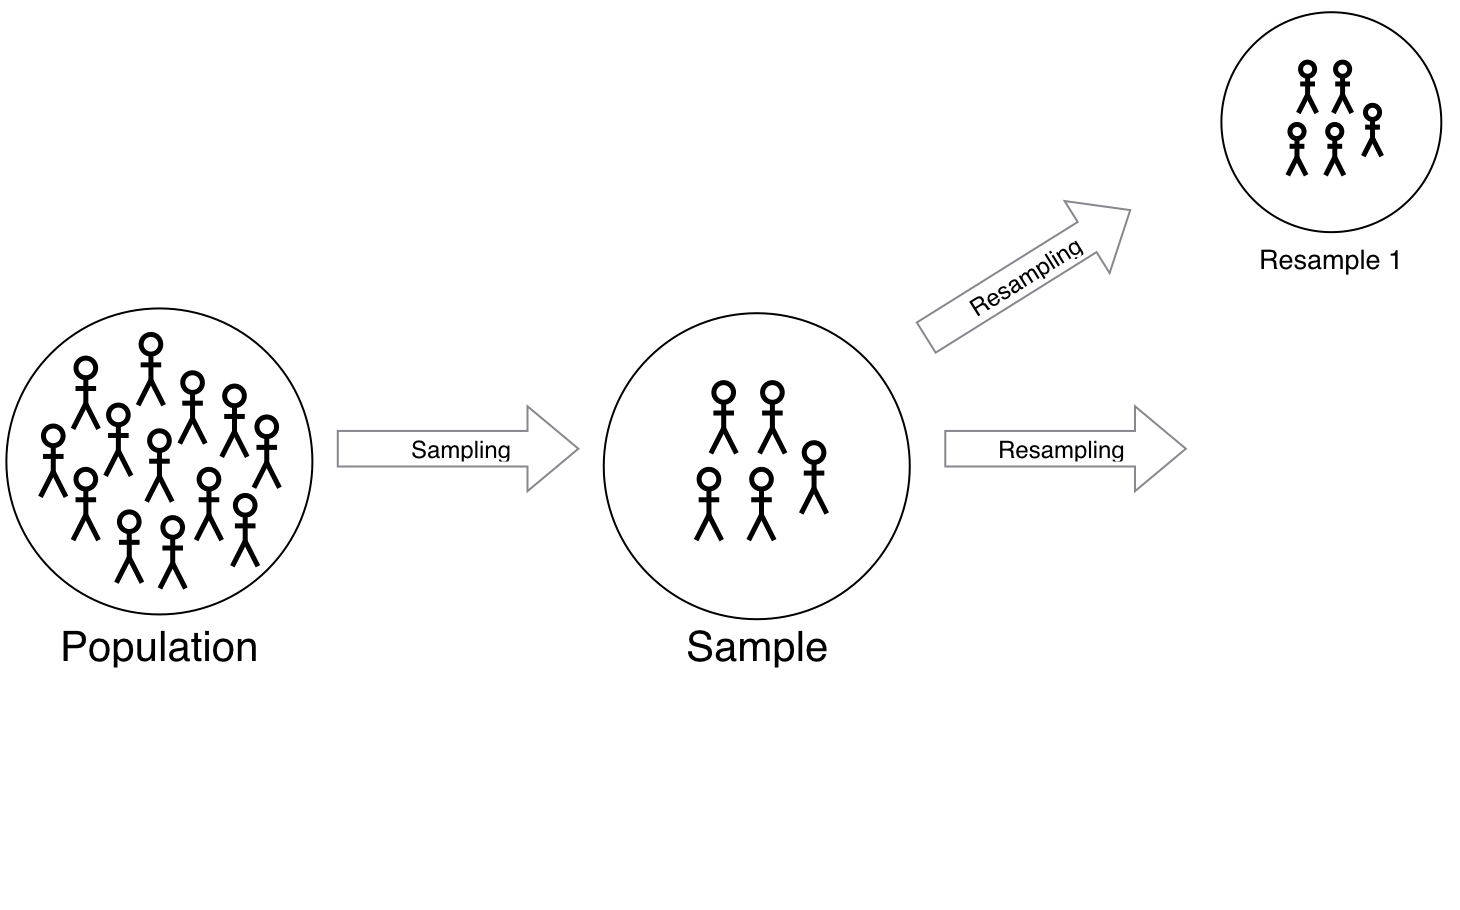
How do $p$ and $\hat{p}$ vary?
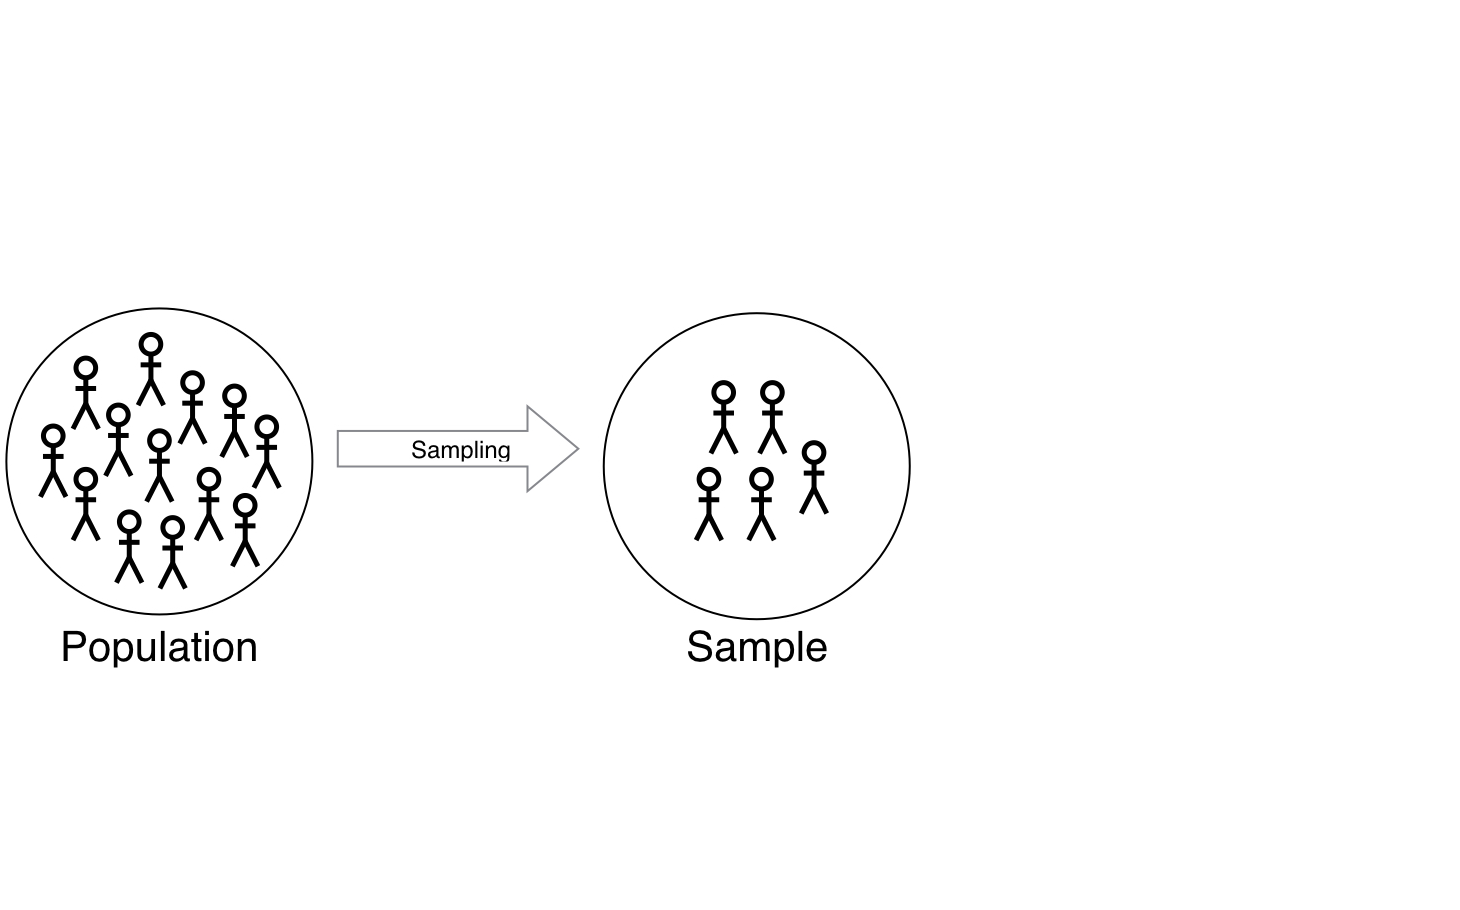
Polling
# Original data
Source: local data frame [30 x 3]
     flip_num  flip
        <int>  <chr>
1          1       H
2          2       H
3          3       H
4          4       T
5          5       H
6          6       H
# ... with 24 more rows
Original data
Candidate X
Total voters
Proportion X
17
30
0.5667
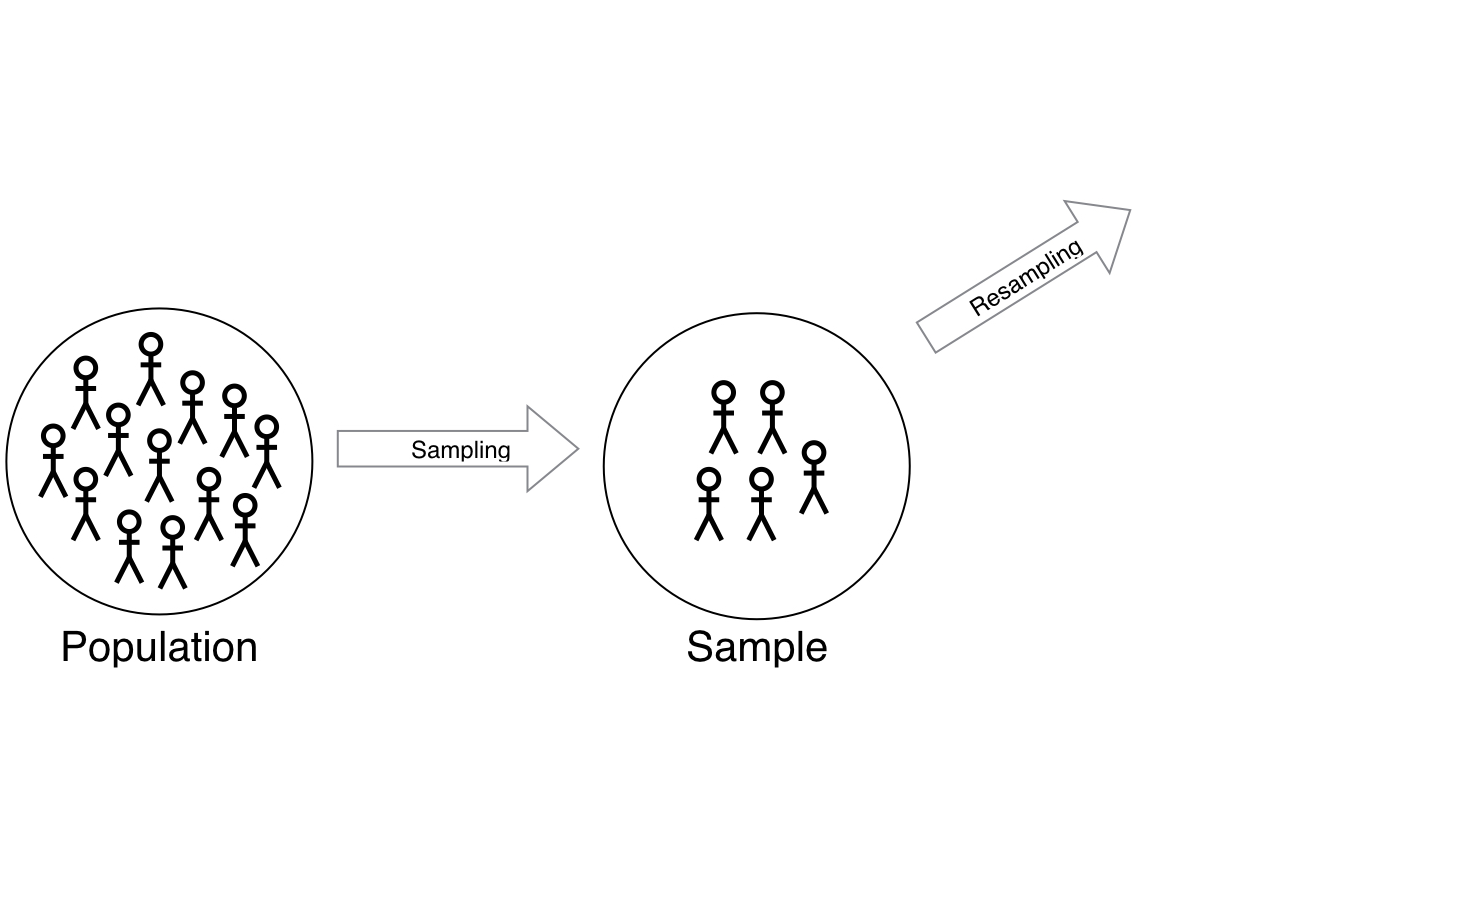
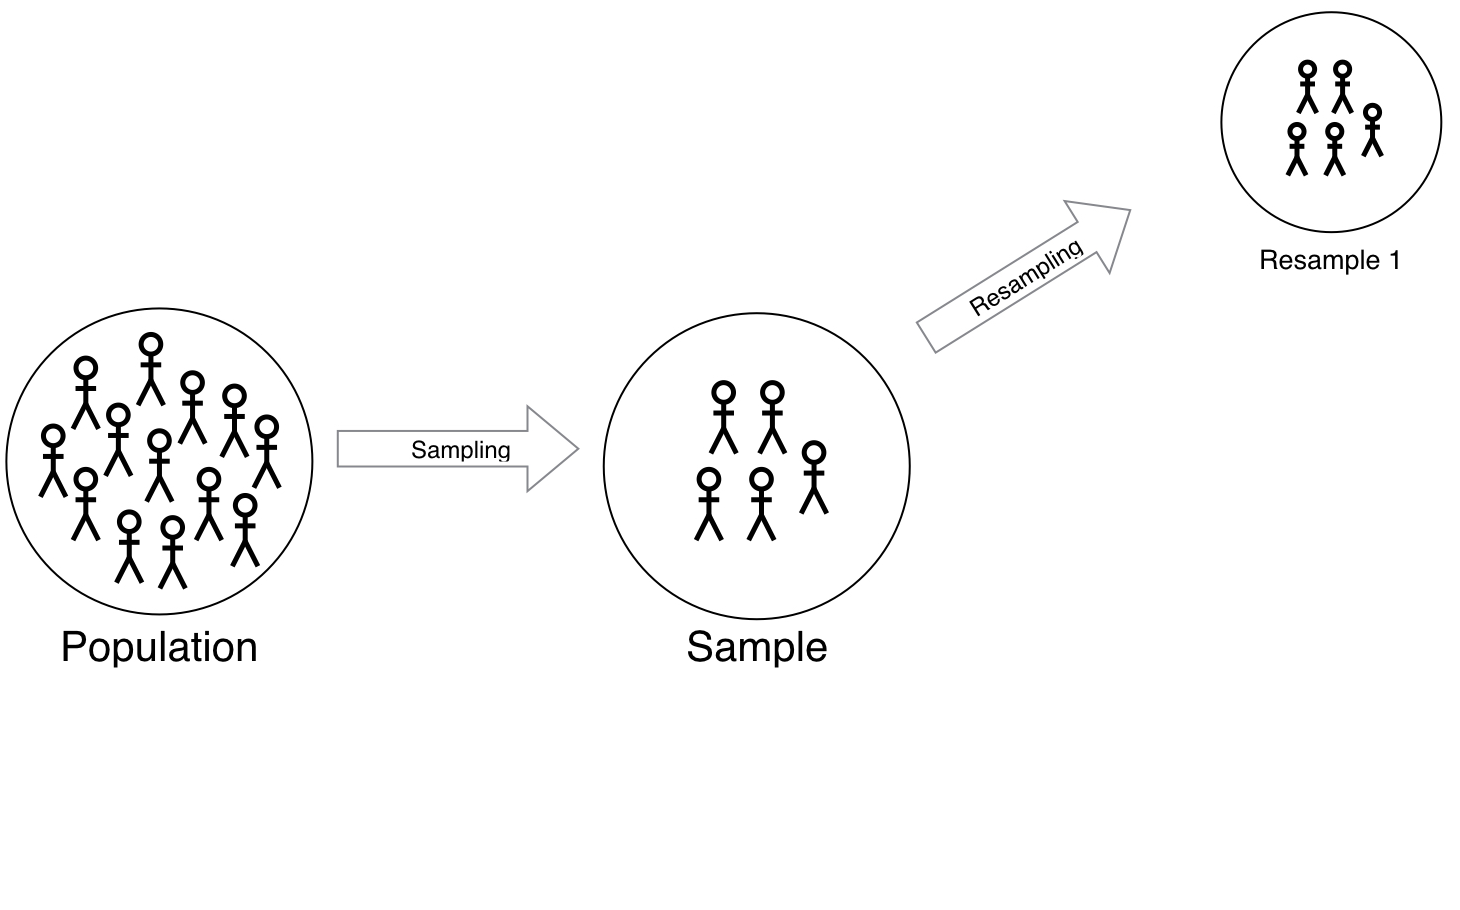
Polling
# First resample
Source: local data frame [30 x 3]
   replicate flip_num  flip
       <dbl>    <int> <chr>
1          1        7     H
2          1       17     T
3          1       13     H
4          1       14     H
5          1       24     H
6          1       28     T
# ... with 24 more rows
First resample
Candidate X
Total voters
Proportion X
17
30
0.5667
14
30
0.4667
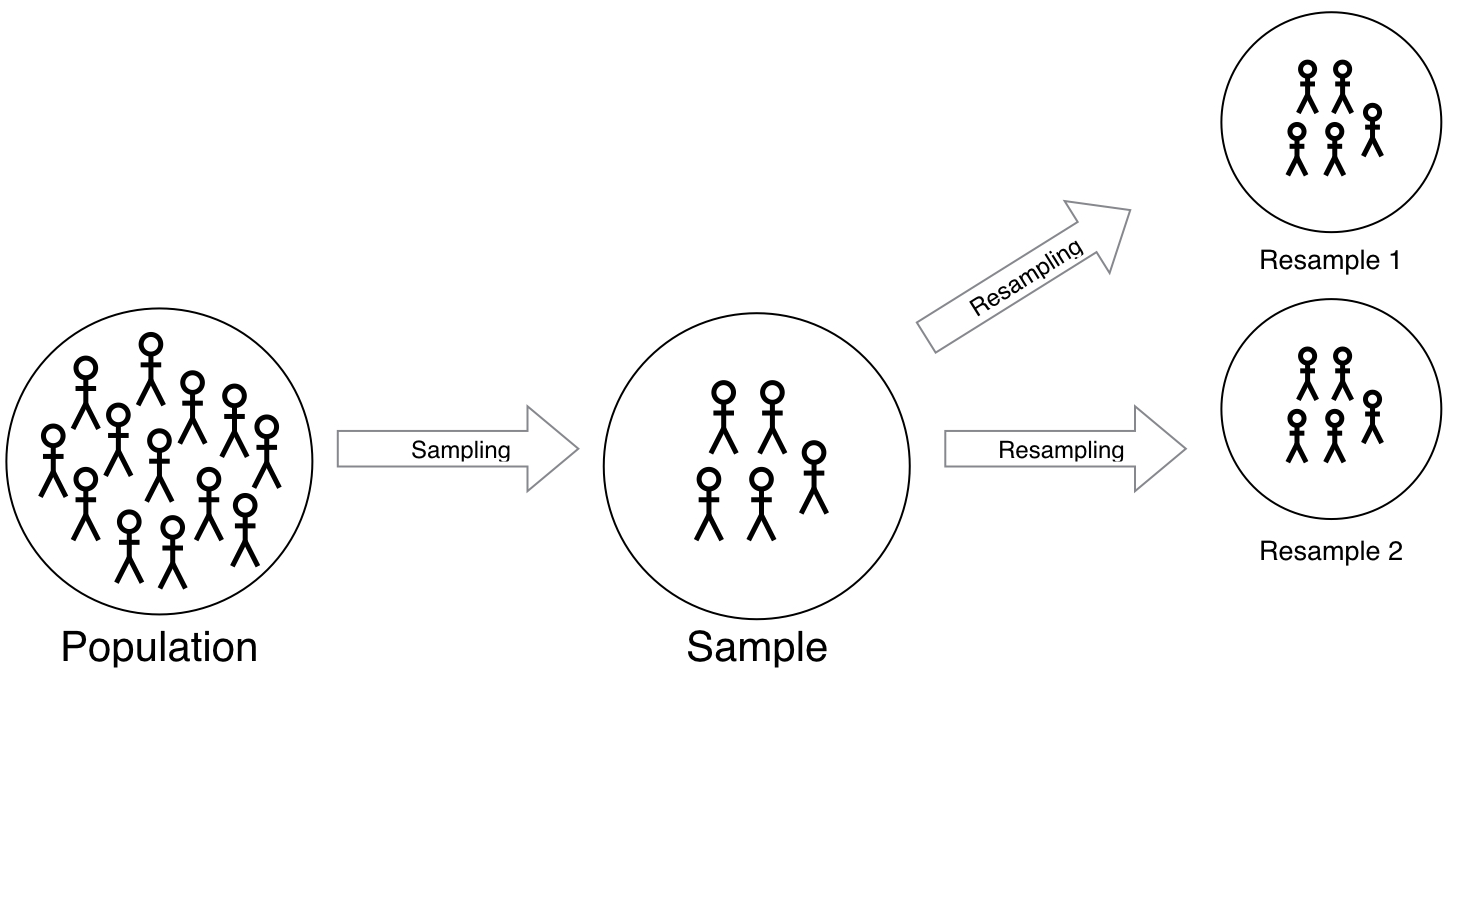
Polling
# Second resample
Source: local data frame [30 x 3]
   replicate flip_num  flip
       <dbl>    <int> <chr>
1          2       21     H
2          2       19     T
3          2       25     H
4          2       24     T
5          2       21     H
6          2       28     T
7          2       13     H
8          2       23     H
9          2       24     T
10         2       24     T
# ... with 20 more rows
Second resample
Candidate X
Total voters
Proportion X
17
30
0.5667
14
30
0.4667
18
30
0.6
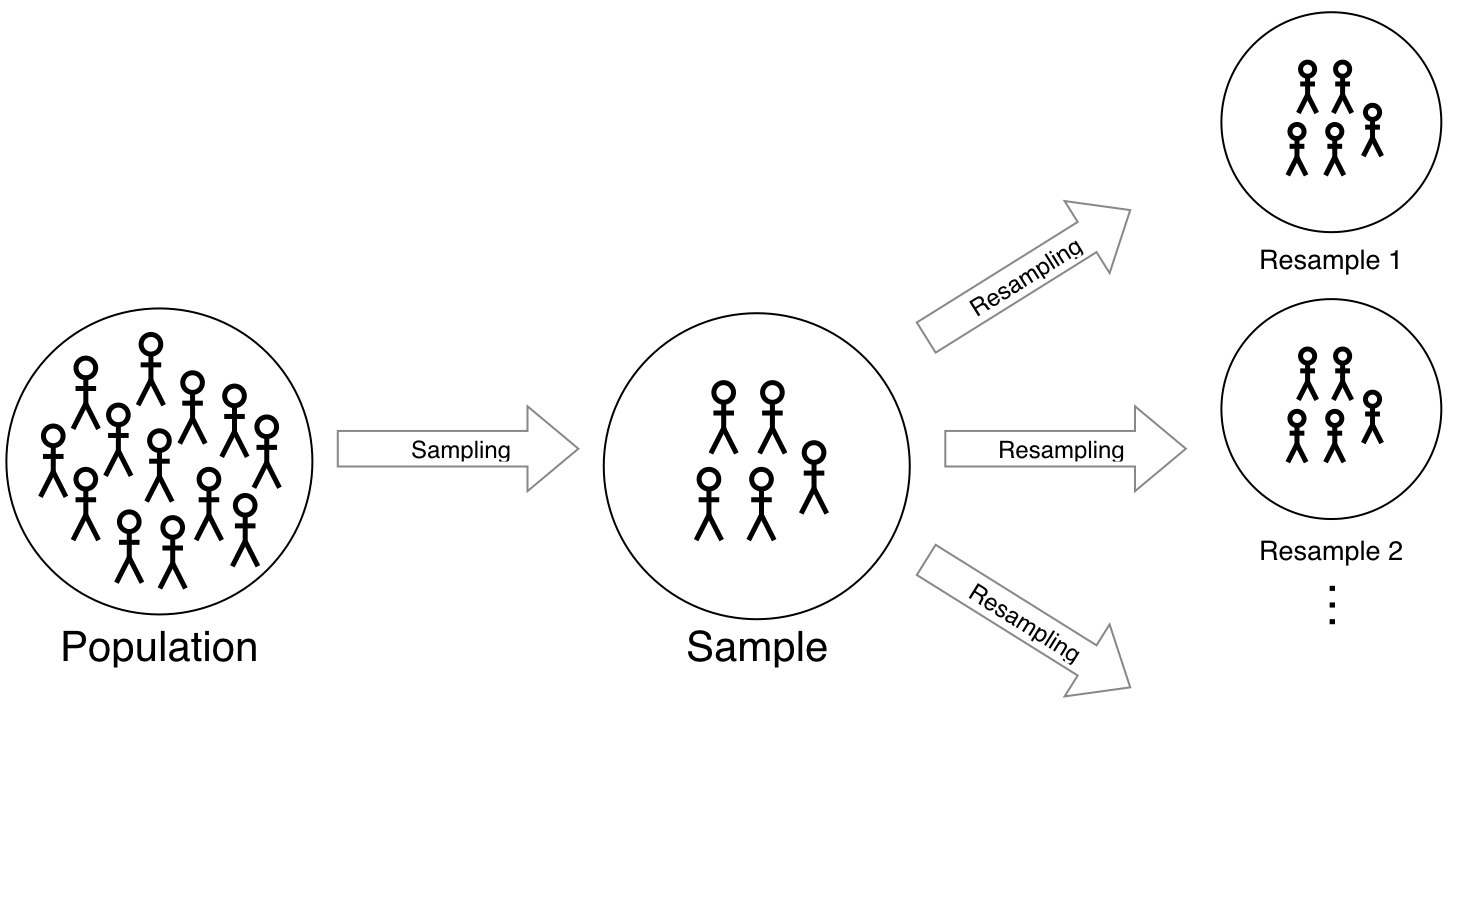
Polling
# Third resample
Source: local data frame [30 x 3]
   replicate flip_num  flip
       <dbl>    <int> <chr>
1          3        6     H
2          3       19     H
3          3        1     H
4          3       24     T
5          3       11     H
6          3       28     T
7          3       16     H
8          3       13     H
9          3       21     T
10         3       29     H
# ... with 20 more rows
Third resample
Candidate X
Total voters
Proportion X
17
30
0.5667
14
30
0.4667
18
30
0.6
12
30
0.4
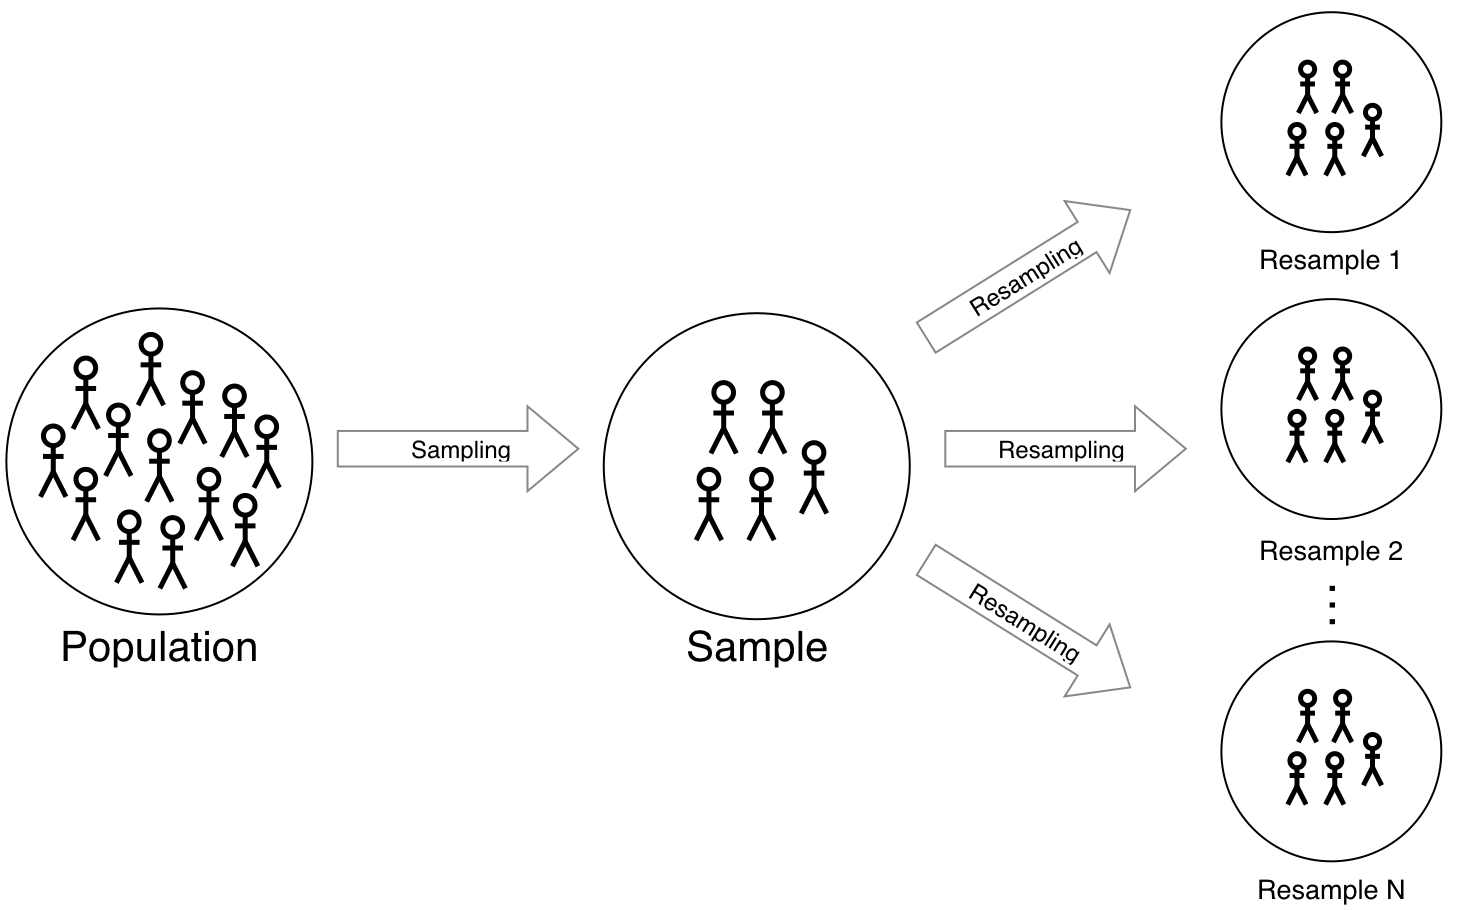
Standard error
Obtained standard error of 0.09 by resampling many times
Describes how the statistic varies around parameter
Bootstrap provides an approximation of the standard error
Variability of p-hat from the population
# Compute p-hat for each poll
ex1_props <- recommend %>%
    group_by(poll) %>%
    summarize(prop_yes =
                mean(vote == "yes"))
# Variability of p-hat
ex1_props %>%
    summarize(sd(prop_yes))
# A tibble: 1 × 1
  `sd(prop_yes)`
           <dbl>
1     0.08523512
Variability of p-hat from the sample (bootstrapping)
# Select one poll from which to resample
one_poll <- all_polls %>%
    filter(poll ==1) %>%
    select(vote)

# Compute p-hat for each resampled poll
ex2_props <- one_poll %>%
    specify(response = vote,
            success = "yes") %>%
    generate(reps = 1000,
            type = "bootstrap")
# Variability of p-hat
ex2_props %>%
    summarize(sd(stat))