Visualizing sound waves
Spoken Language Processing in Python

Daniel Bourke
Machine Learning Engineer/YouTube Creator
Adding another sound wave
- New audio file:
good_afternoon.wav - Both are 48 kHz
- Same data transformations to all audio files
Setting up a plot
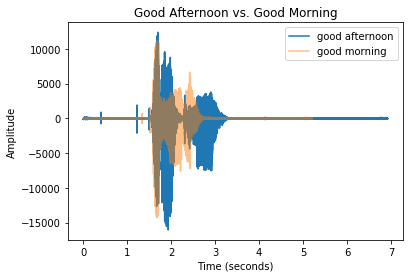
import matplotlib.pyplot as plt# Initialize figure and setup title plt.title("Good Afternoon vs. Good Morning")# x and y axis labels plt.xlabel("Time (seconds)") plt.ylabel("Amplitude")# Add good morning and good afternoon values plt.plot(time_ga, soundwave_ga, label ="Good Afternoon") plt.plot(time_gm, soundwave_gm, label="Good Morning", alpha=0.5)# Create a legend and show our plot plt.legend() plt.show()

Time to visualize!
Spoken Language Processing in Python

