Outliers

Exploratory Data Analysis in R

Andrew Bray

Assistant Professor, Reed College

Characteristics of a distribution

  • Center

  • Variability

  • Shape

  • Outliers

Exploratory Data Analysis in R

ch3_4.003.png

Exploratory Data Analysis in R

Indicating outliers

life <- life %>%
  mutate(is_outlier = income > 75000)
life %>%
  filter(is_outlier) %>%
  arrange(desc(income))
# A tibble: 45 x 6
           state             county expectancy income west_coast is_outlier
           <chr>              <chr>      <dbl>  <int>      <lgl>      <lgl>
1        Wyoming       Teton County     82.110 194861      FALSE       TRUE
2       New York    New York County     81.675 156708      FALSE       TRUE
3          Texas Shackelford County     75.400 132989      FALSE       TRUE
4       Colorado      Pitkin County     82.990 126137      FALSE       TRUE
5       Nebraska     Wheeler County     79.180 125171      FALSE       TRUE
6     California       Marin County     83.230 109076       TRUE       TRUE
7       Nebraska     Kearney County     79.630 108975      FALSE       TRUE
8          Texas    McMullen County     77.320 107627      FALSE       TRUE
9  Massachusetts   Nantucket County     80.325 107341      FALSE       TRUE
10         Texas     Midland County     77.830 106588      FALSE       TRUE
# ... with 35 more rows
Exploratory Data Analysis in R

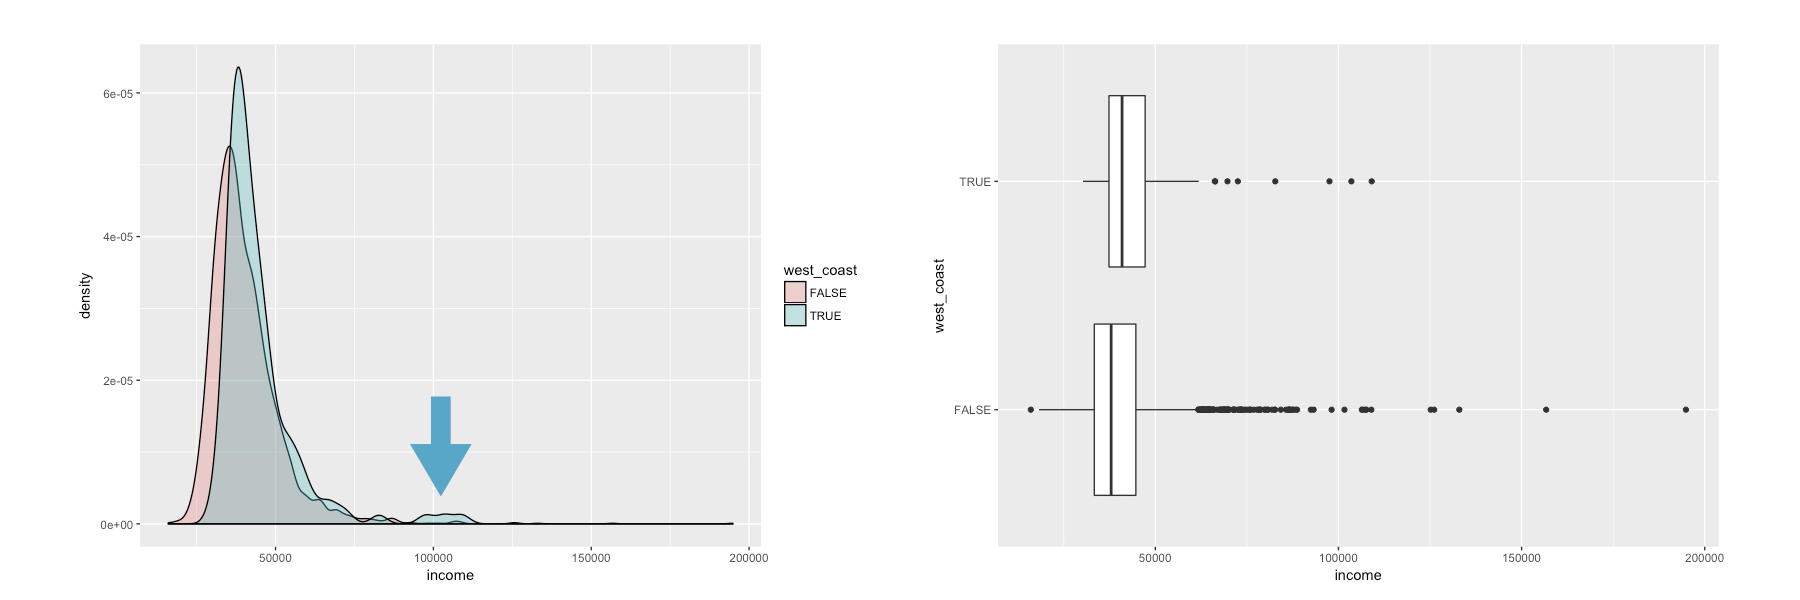
Plotting without outliers
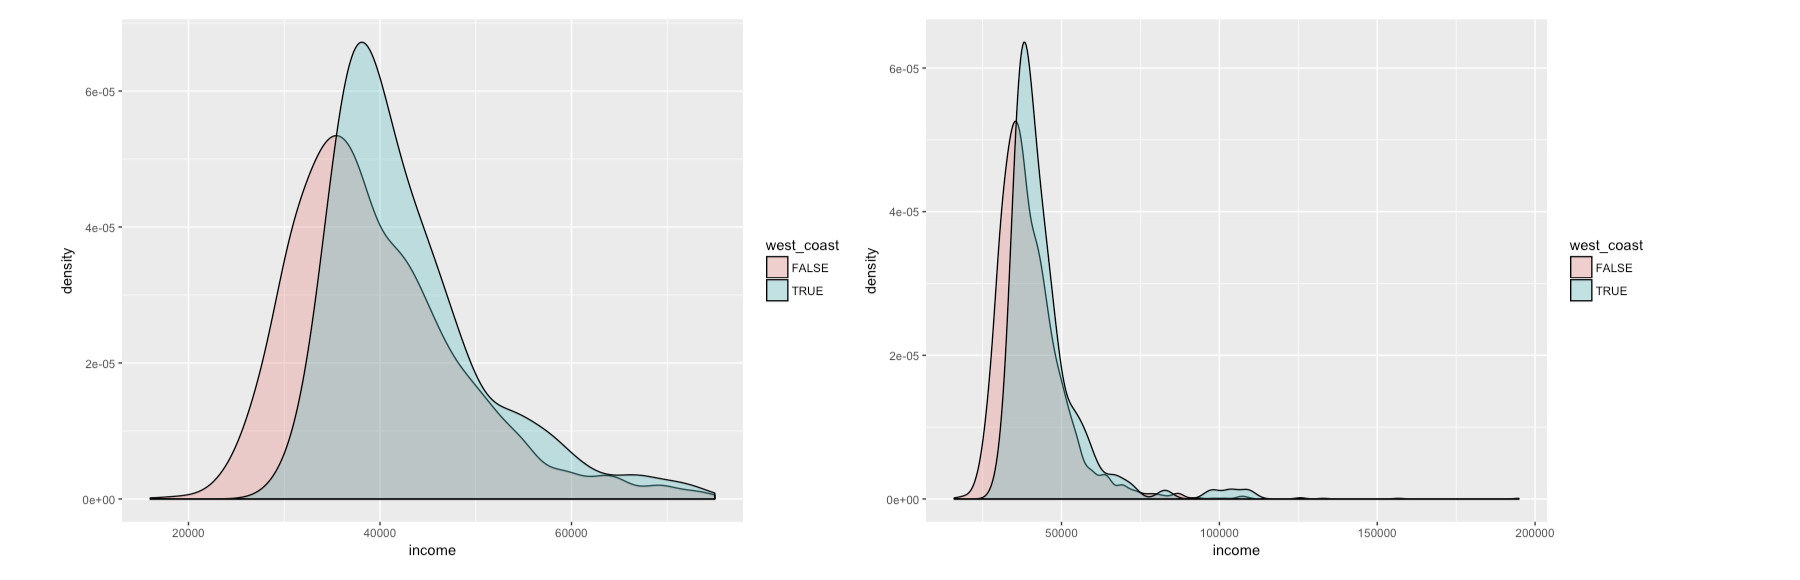
life %>%
  filter(!is_outlier) %>%

ggplot(aes(x = income, fill = west_coast)) + geom_density(alpha = .3)

ch3_4.005.png

Exploratory Data Analysis in R

Let's practice!

Exploratory Data Analysis in R

Preparing Video For Download...