Visualization in higher dimensions
Exploratory Data Analysis in R

Andrew Bray
Assistant Professor, Reed College
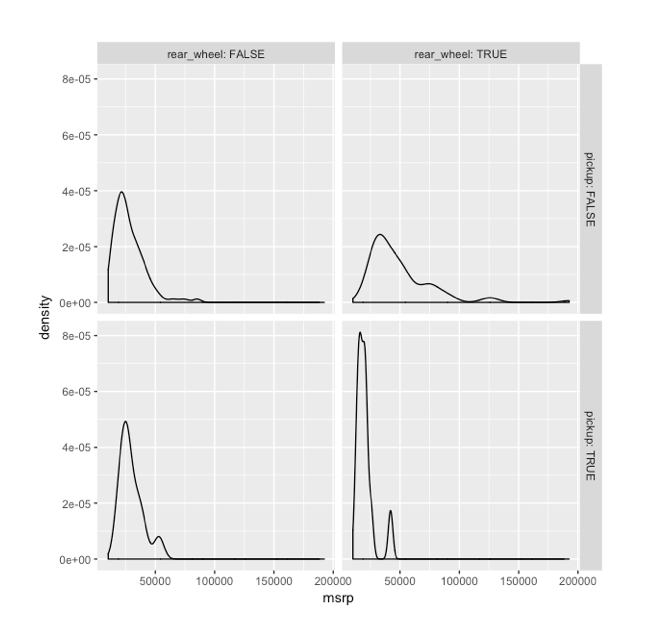
Plots for 3 variables
ggplot(cars, aes(x = msrp)) +
  geom_density() +
  facet_grid(pickup ~ rear_wheel)
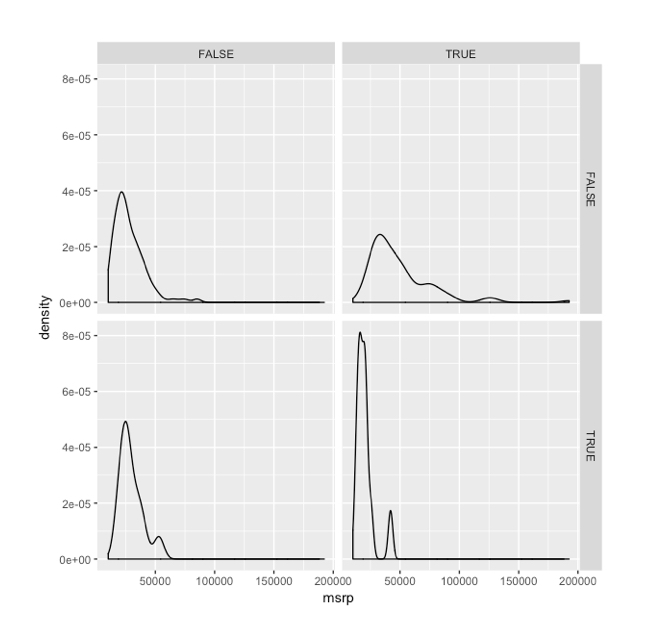
Plots for 3 variables
ggplot(cars, aes(x = msrp)) +
  geom_density() +
  facet_grid(pickup ~ rear_wheel, labeller = label_both)