Introducing the data
Exploratory Data Analysis in R

Andrew Bray
Assistant Professor, Reed College
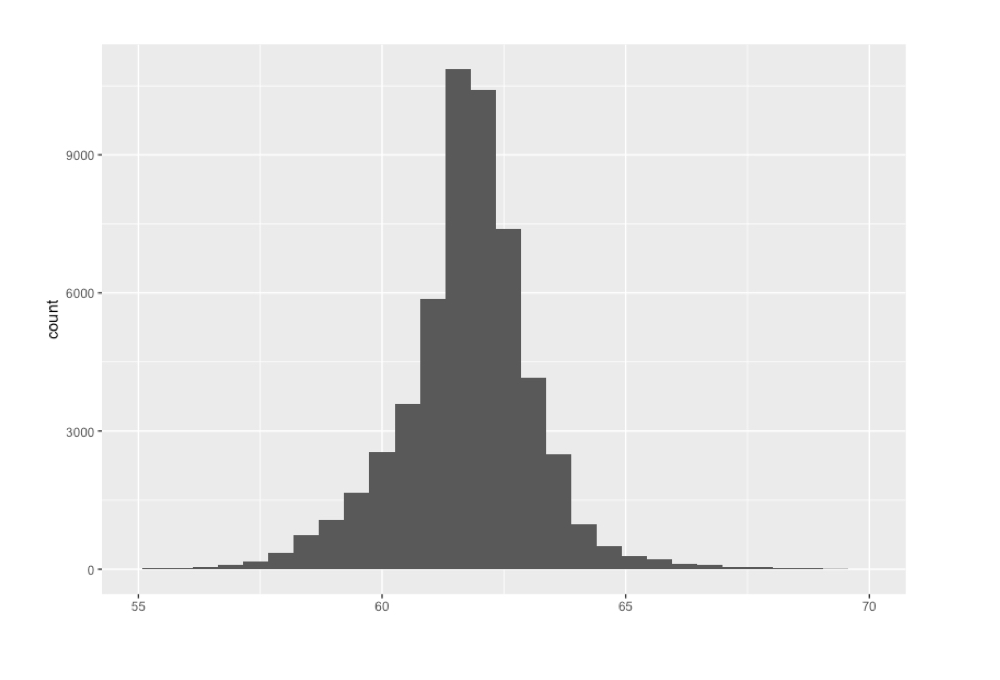
Histograms
ggplot(data, aes(x = var1)) +
  geom_histogram()
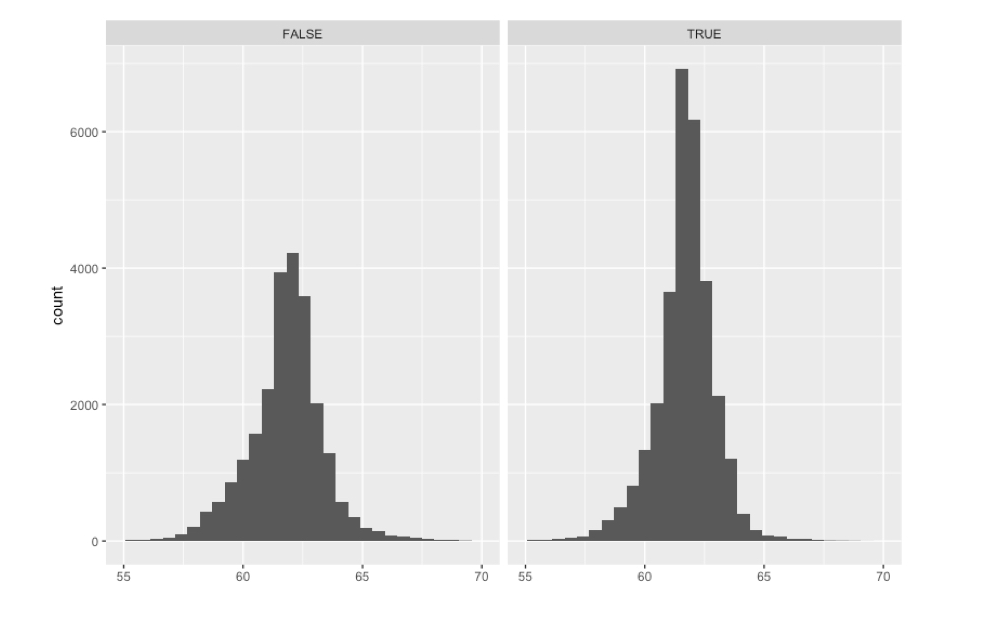
Histograms
ggplot(data, aes(x = var1)) +
  geom_histogram() +
  facet_wrap(~var2)
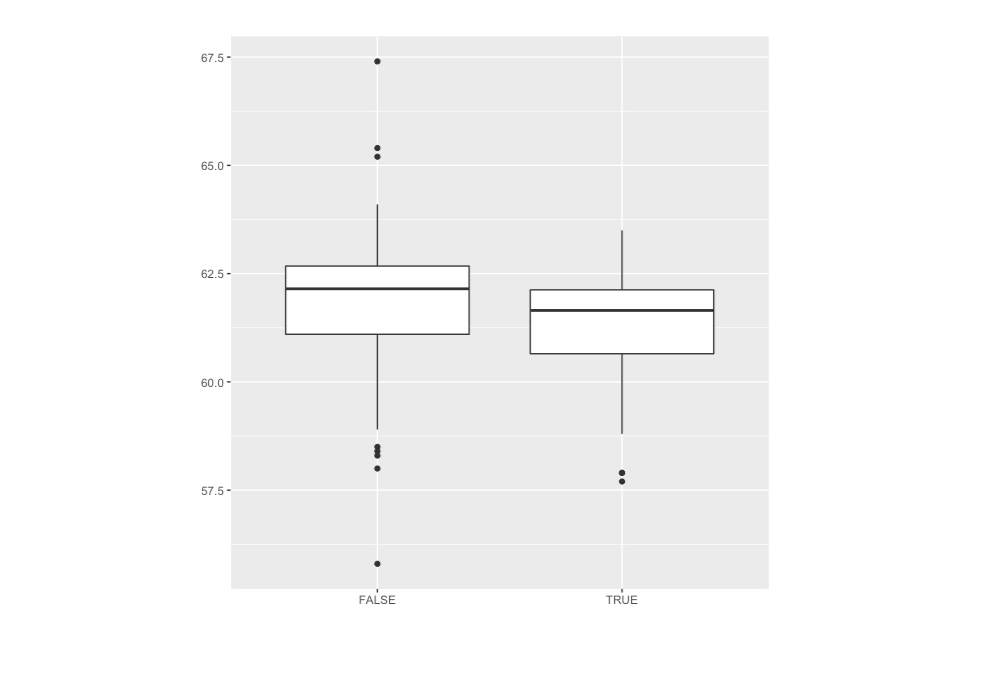
Boxplots
ggplot(data, aes(x = var2, y = var1)) +
  geom_boxplot()
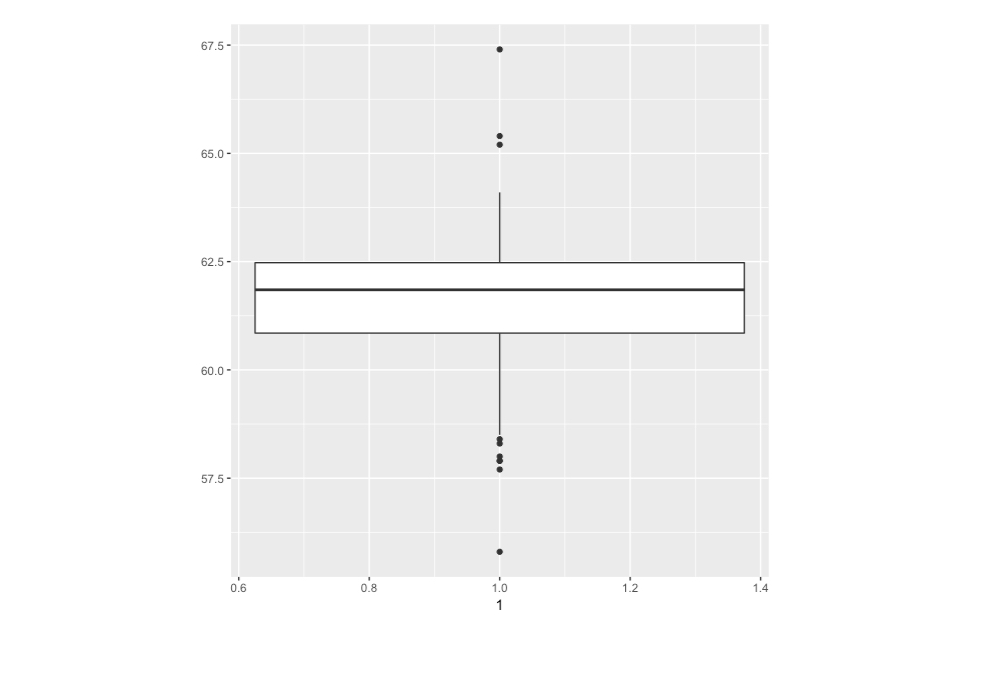
Boxplots
ggplot(data, aes(x = 1, y = var1)) +
  geom_boxplot()
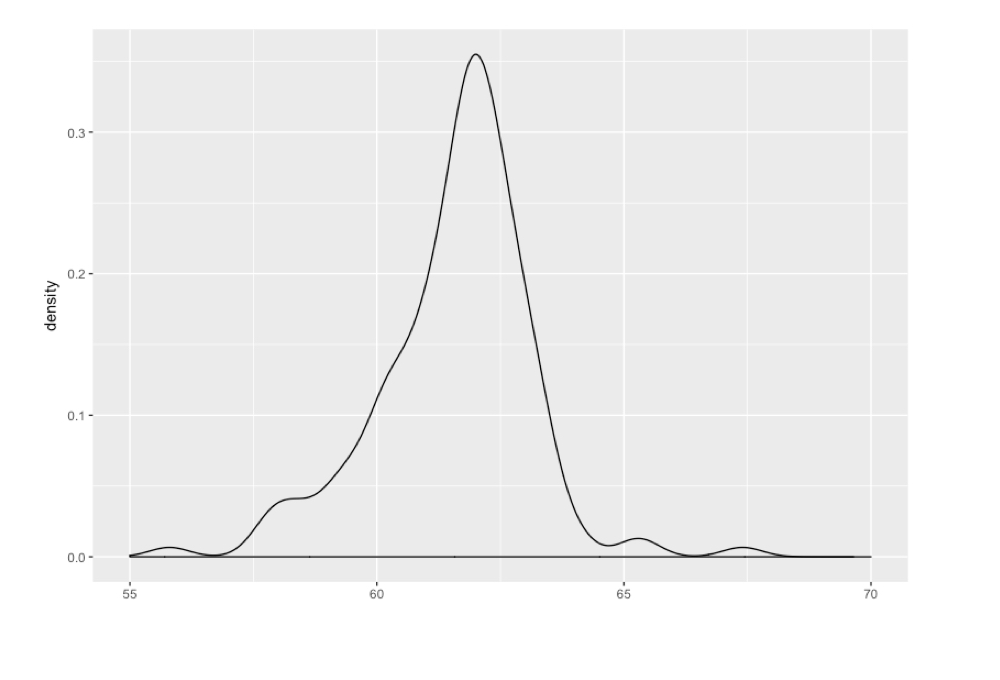
Density plots
ggplot(data, aes(x = var1)) +
  geom_density()
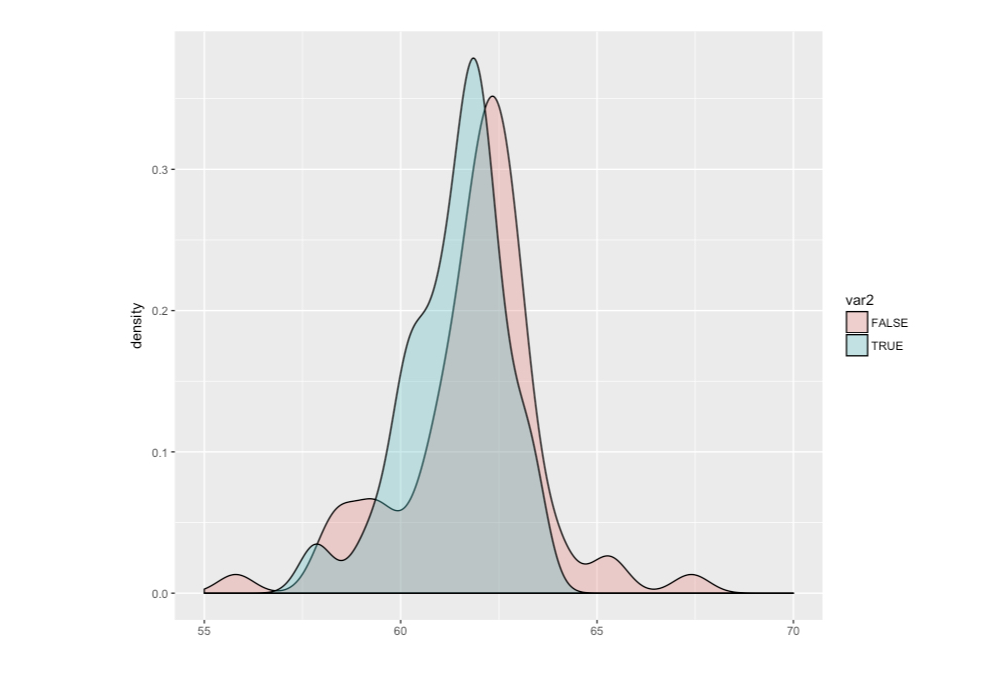
Density plots
ggplot(data, aes(x = var1, fill = var2)) +
  geom_density(alpha = .3)