ARIMA diagnostics
ARIMA Models in R

David Stoffer
Professor of Statistics at the University of Pittsburgh
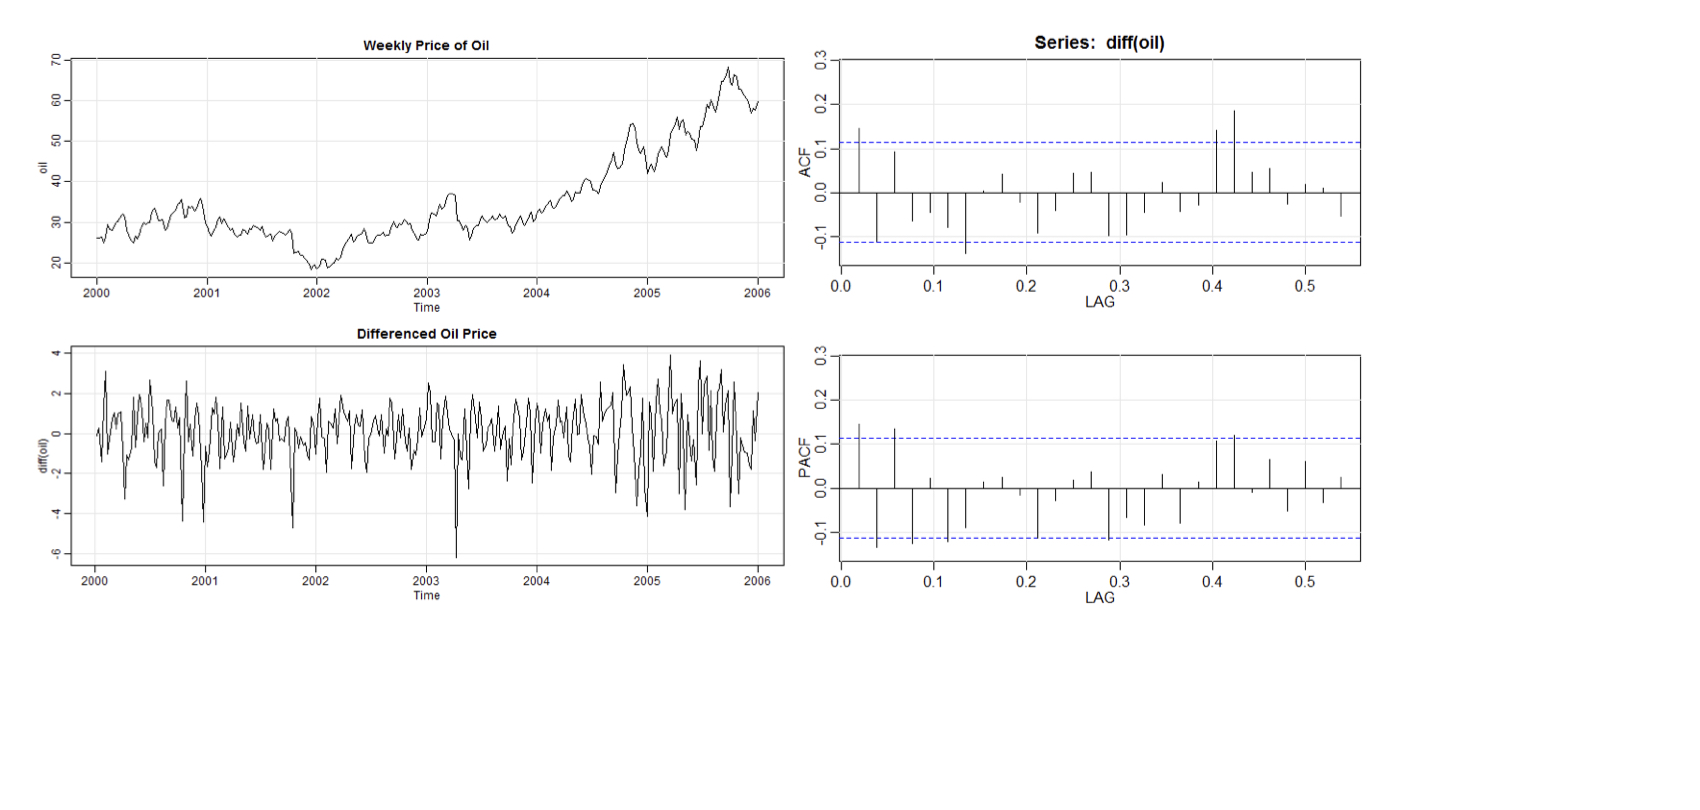
Weekly Oil Prices ARIMA(1, 1, 1)?
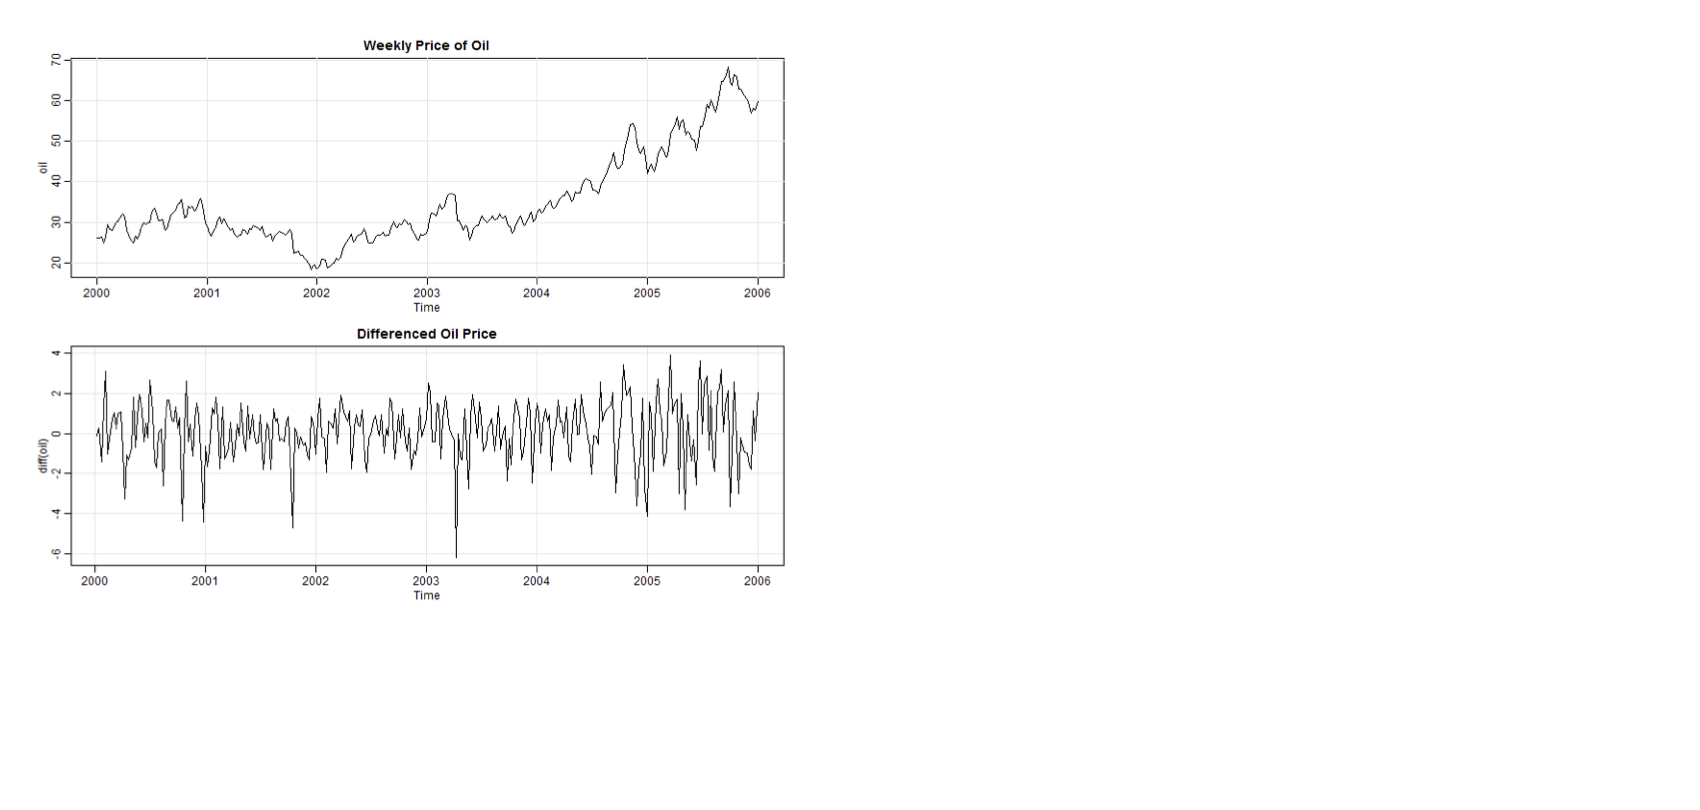
Weekly Oil Prices ARIMA(1, 1, 1)?
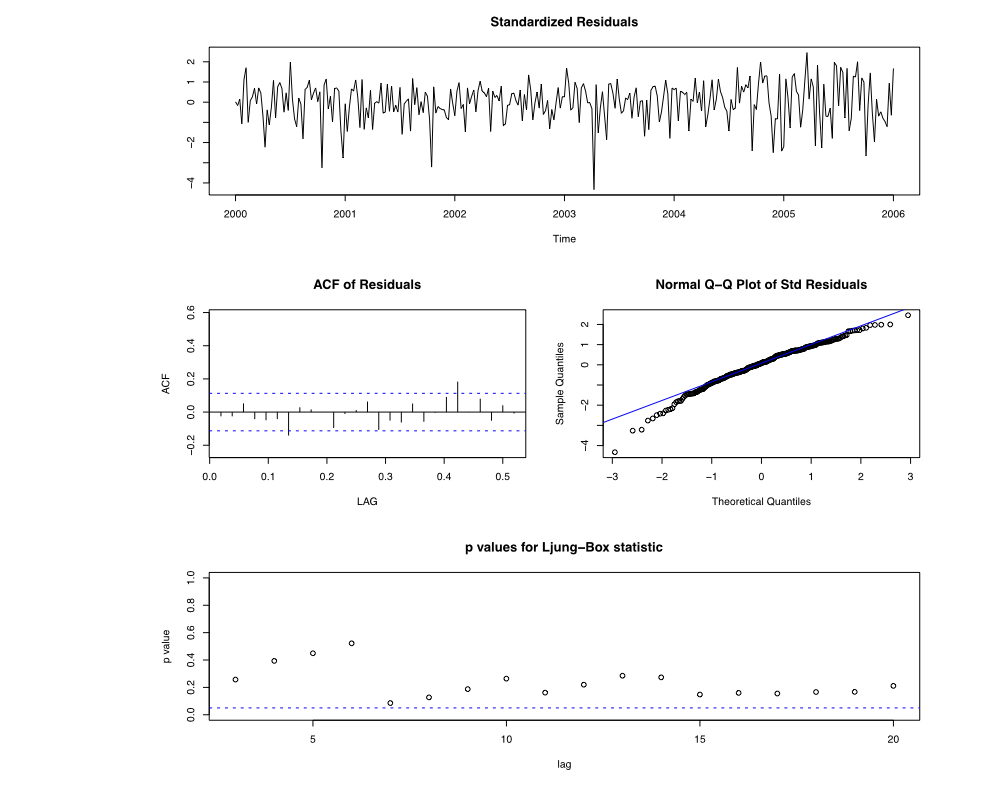
Weekly Oil Prices ARIMA(1, 1, 1)!
ARIMA Models in R
David Stoffer
Professor of Statistics at the University of Pittsburgh

