Mixed seasonal models
ARIMA Models in R

David Stoffer
Professor of Statistics at the University of Pittsburgh
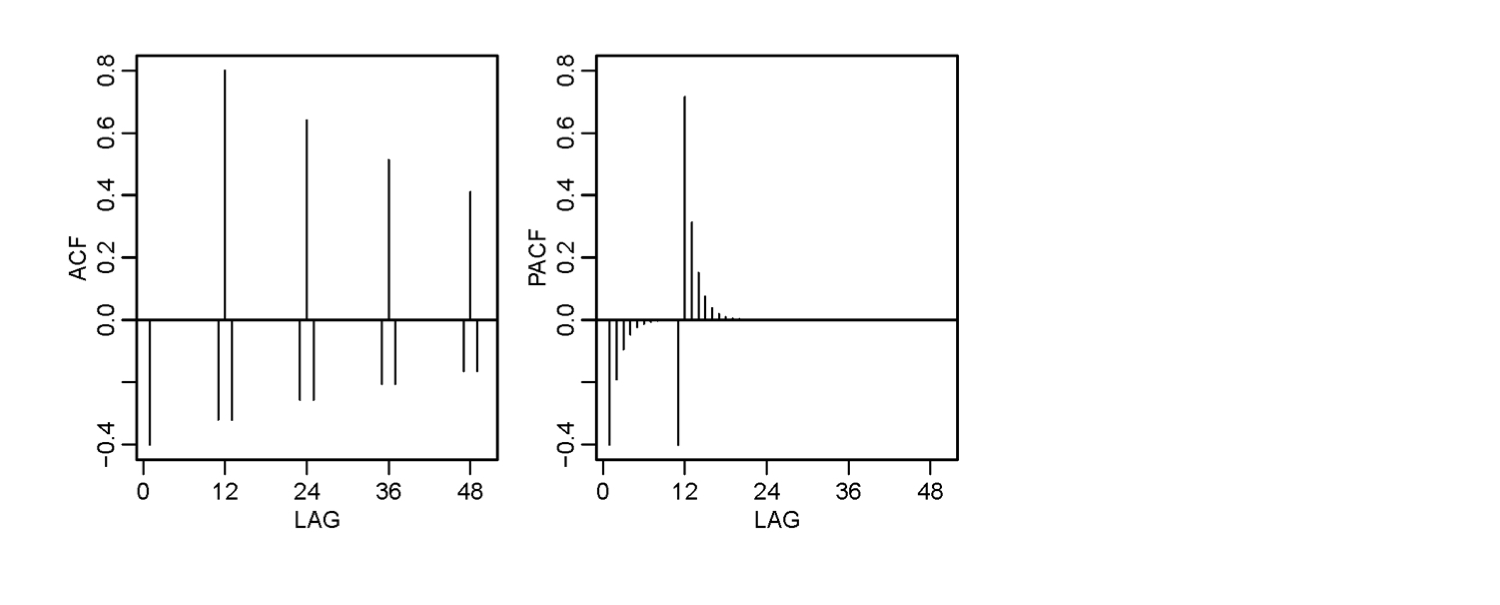
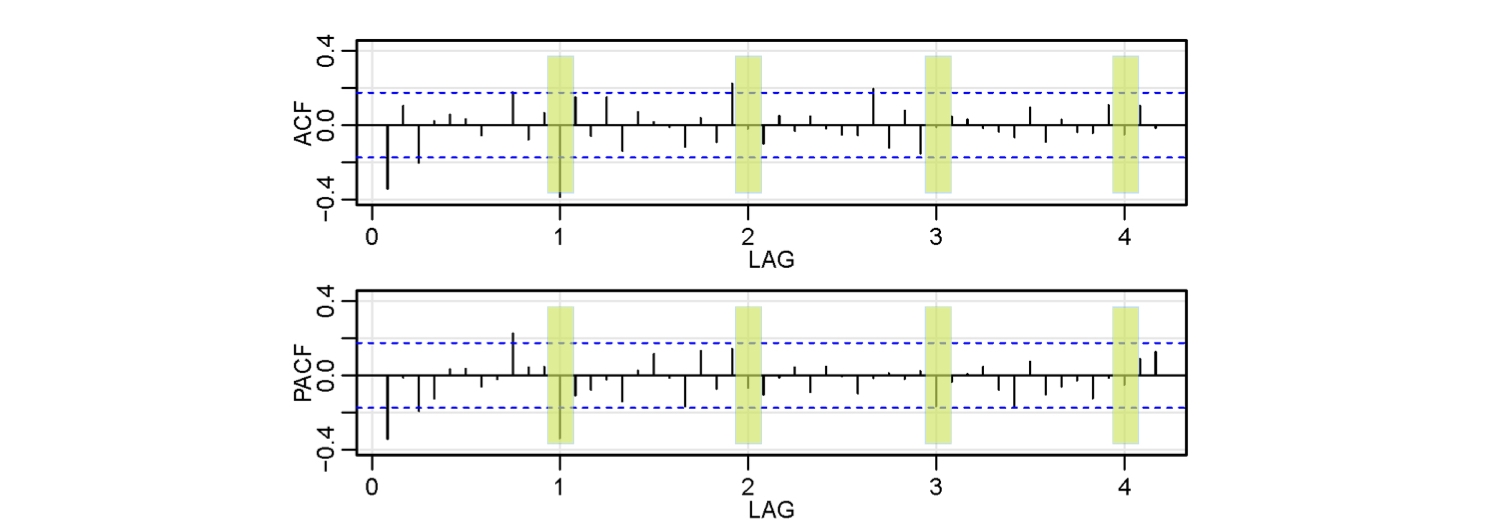
ACF and PACF of SARIMA(0,0,1) x (1,0,0) s=12
- The ACF and PACF for this mixed model:
$$X_t = .8 X_{t-12} + W_t -.5 W_{t-1}$$
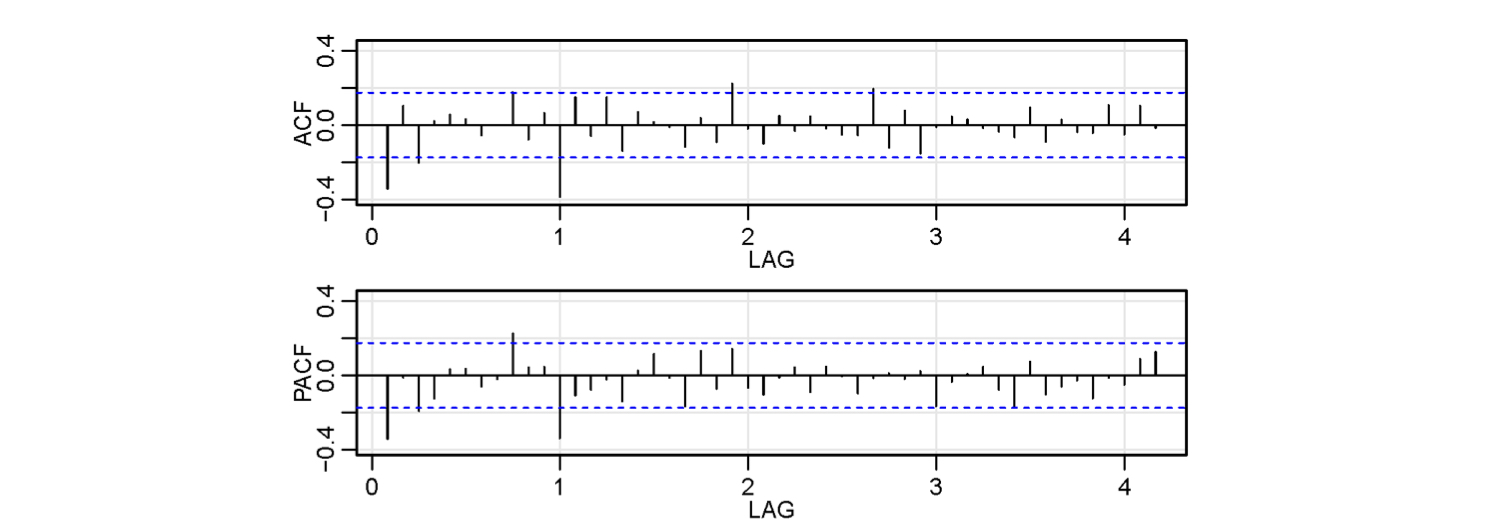
ACF and PACF of SARIMA(0,0,1) x (1,0,0) s=12
- The ACF and PACF for this mixed model:
$$X_t = .8 X_{t-12} + W_t -.5 W_{t-1}$$
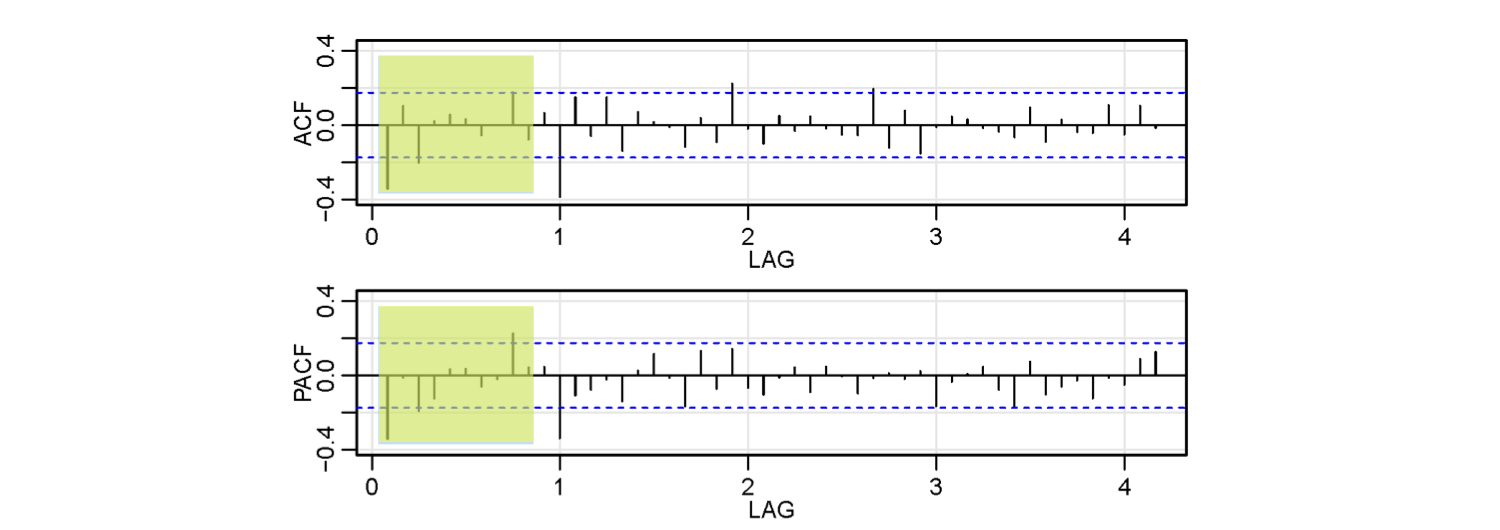
ACF and PACF of SARIMA(0,0,1) x (1,0,0) s=12
- The ACF and PACF for this mixed model:
$$X_t = .8 X_{t-12} + W_t -.5 W_{t-1}$$
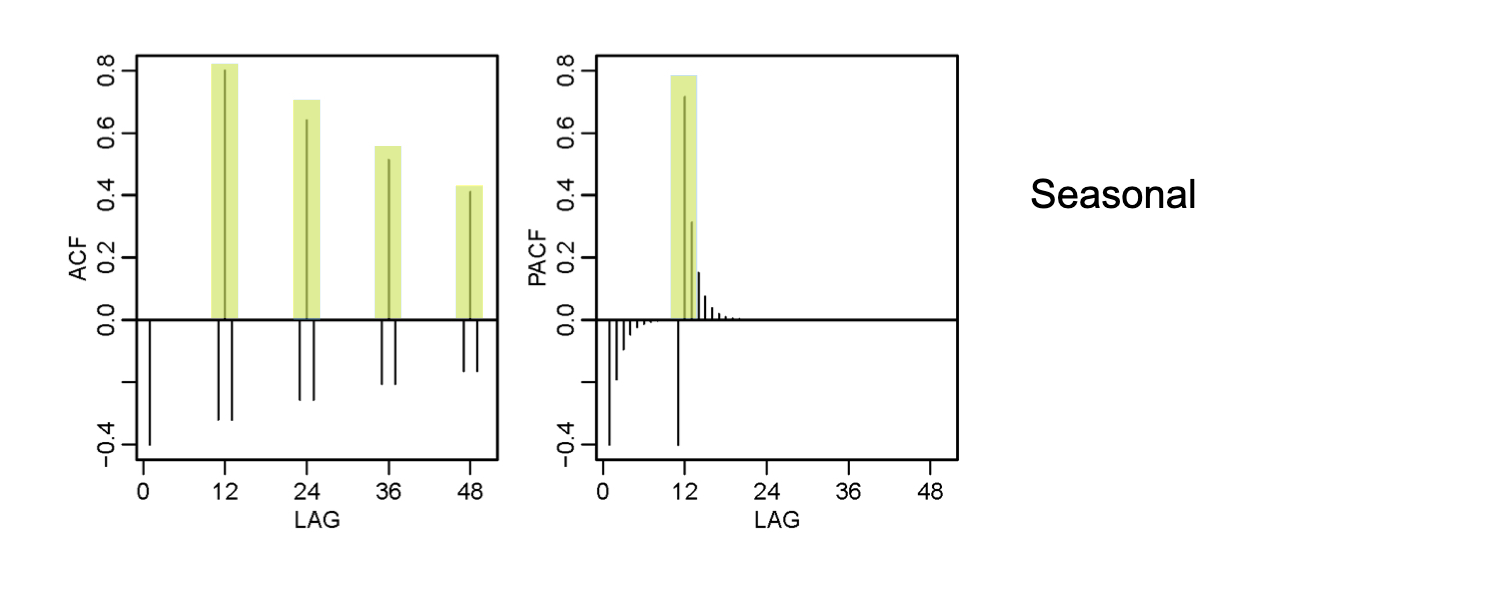
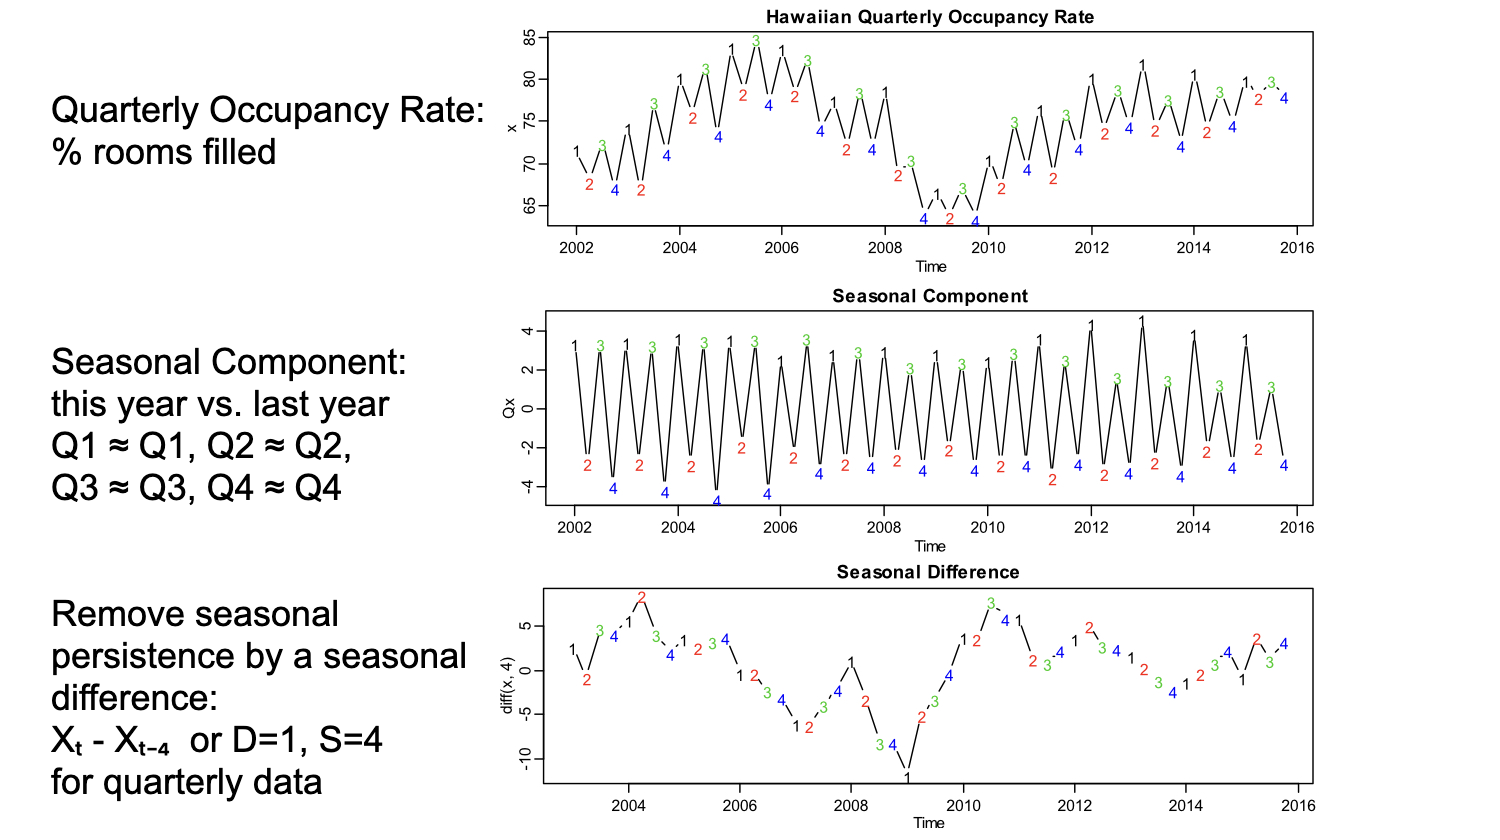
Seasonal Persistence
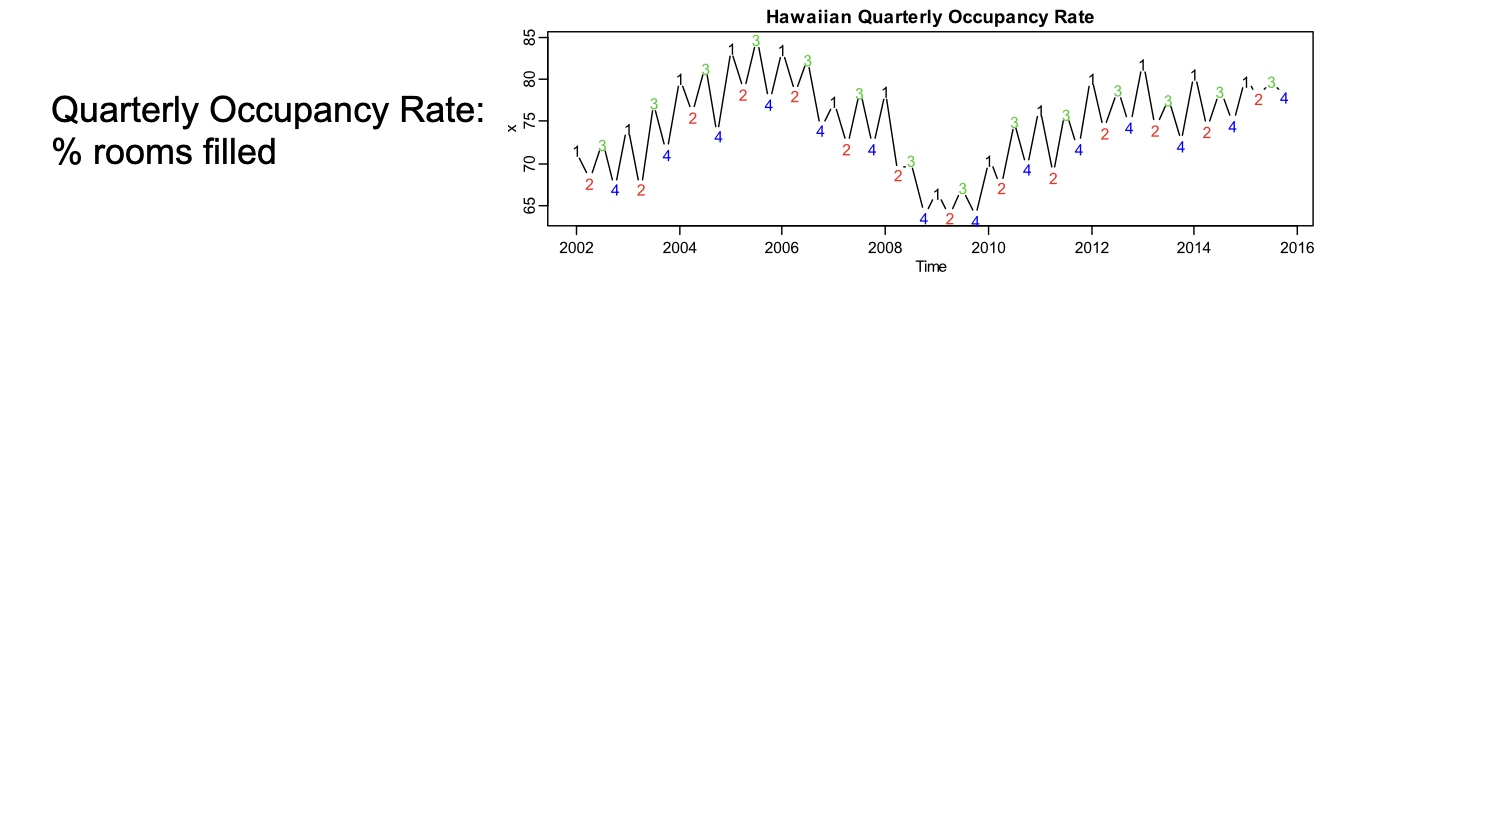
Seasonal Persistence
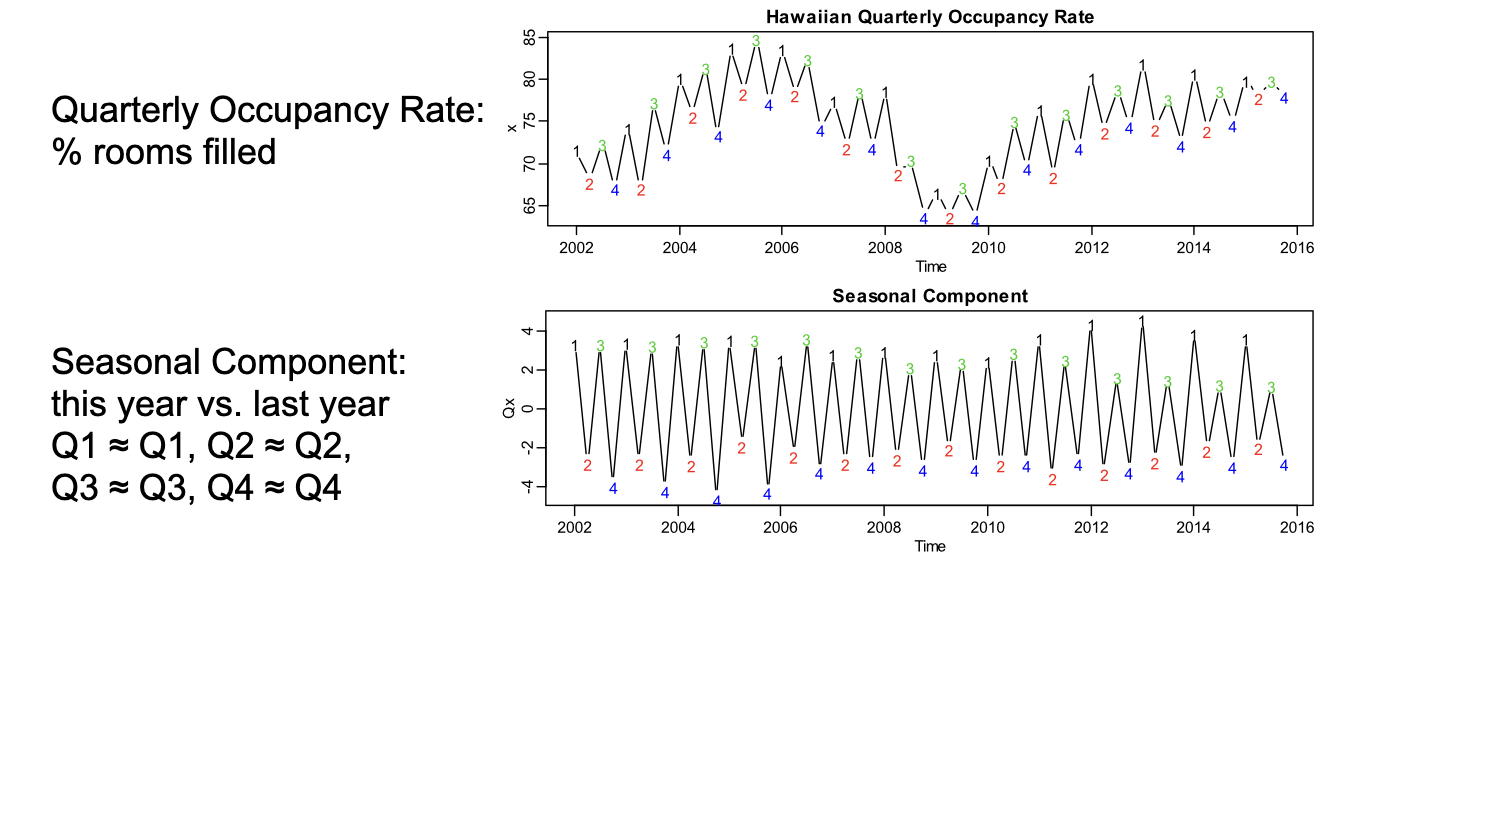
Seasonal Persistence
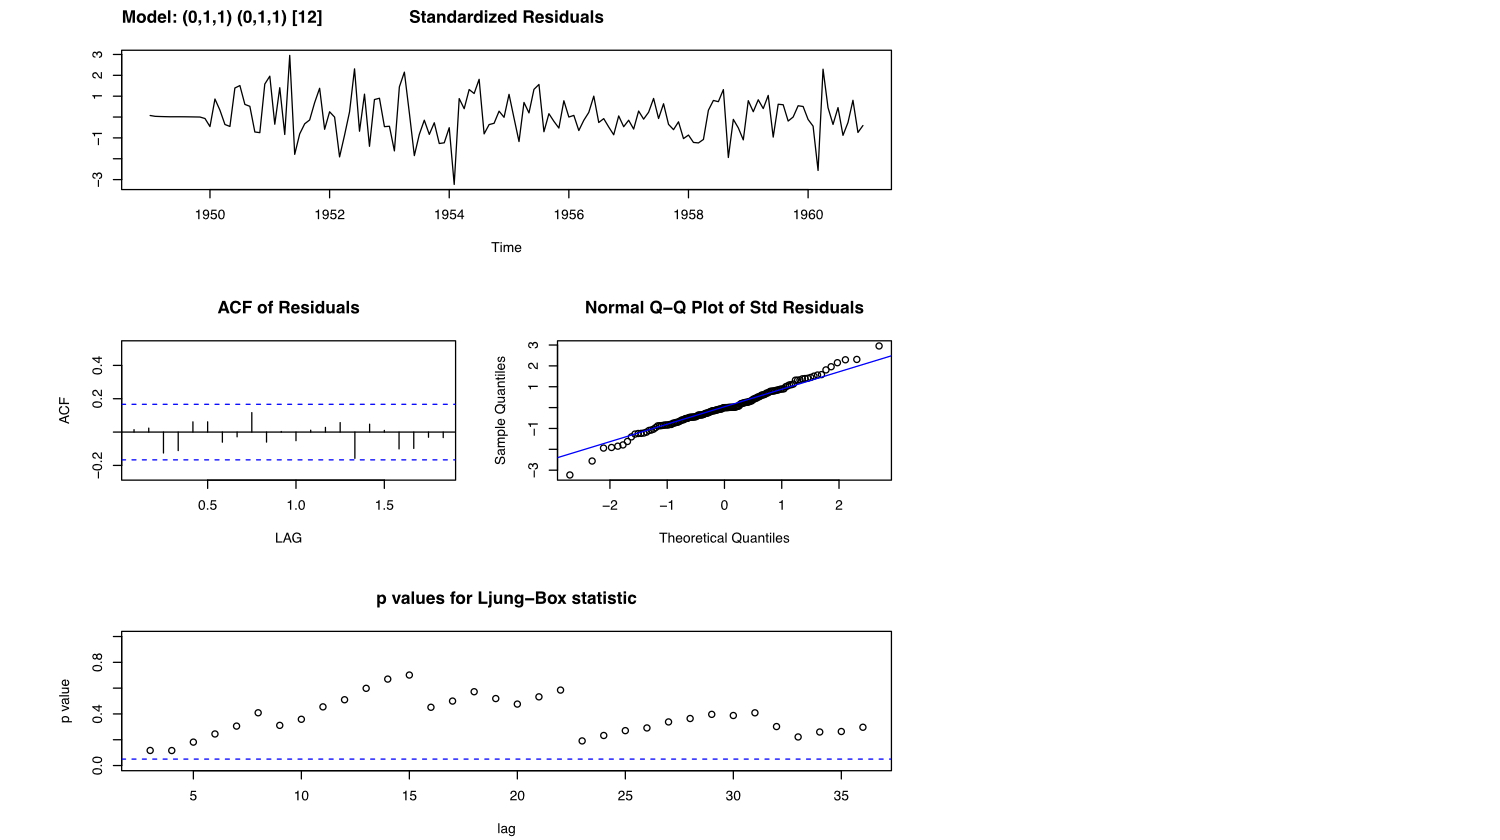
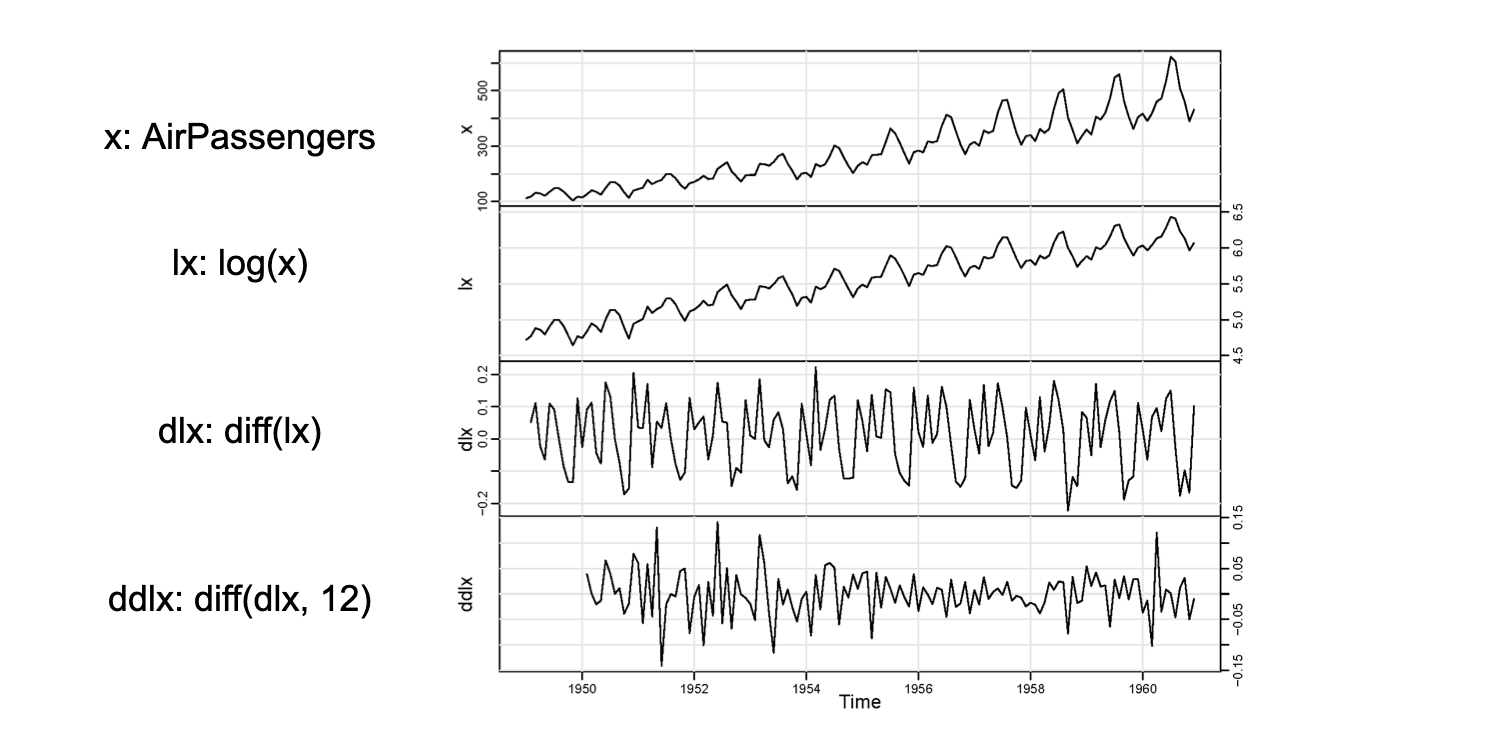
Air Passengers
- Monthly totals of international airline passengers, 1949-1960
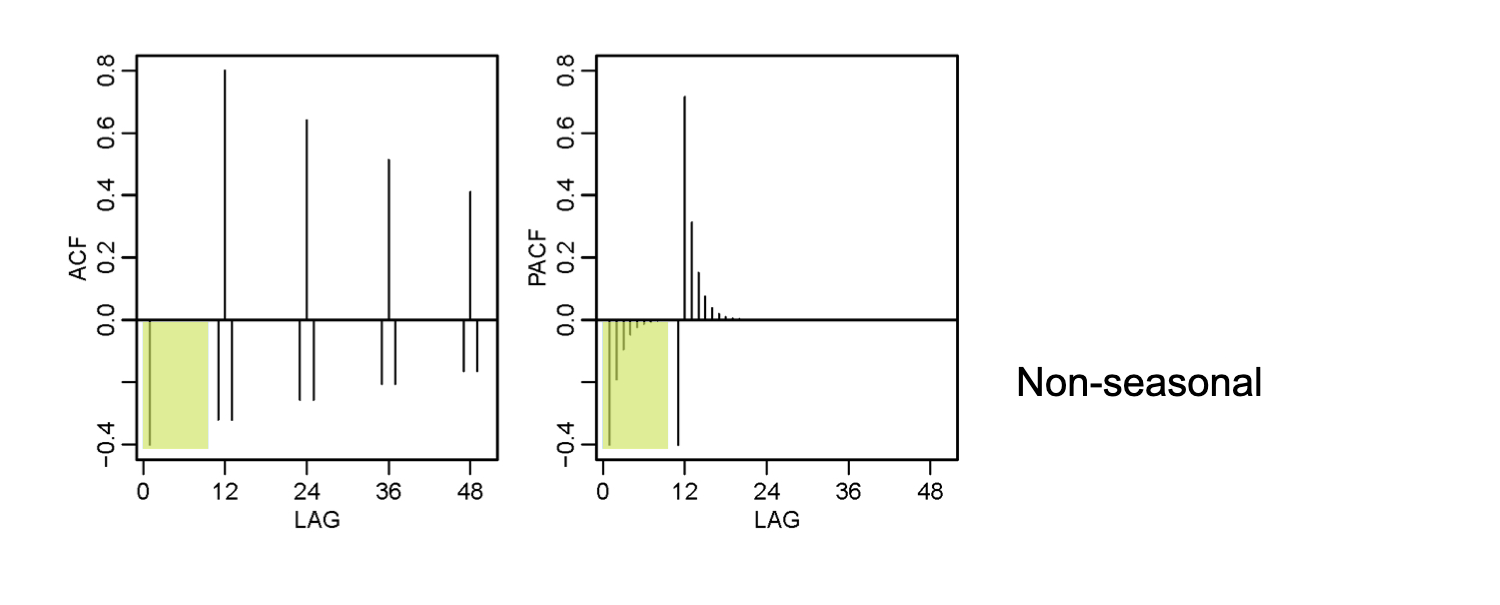
Air Passengers: ACF and PACF of ddlx

Air Passengers: ACF and PACF of ddlx
- Seasonal: ACF cutting off at lag 1s (s = 12); PACF tailing off at lags 1s, 2s, 3s…
Air Passengers: ACF and PACF of ddlx
- Seasonal: ACF cutting off at lag 1s (s = 12); PACF tailing off at lags 1s, 2s, 3s…
Air Passengers: ACF and PACF of ddlx
Seasonal: ACF cutting off at lag 1s (s = 12); PACF tailing off at lags 1s, 2s, 3s…
Non-Seasonal: ACF and PACF both tailing off
Air Passengers