First things first
ARIMA Models in R

David Stoffer
Professor of Statistics at the University of Pittsburgh
About Me
- Professor of Statistics

About Me
- Professor of Statistics
- Co-author of two texts on time series
astsapackage

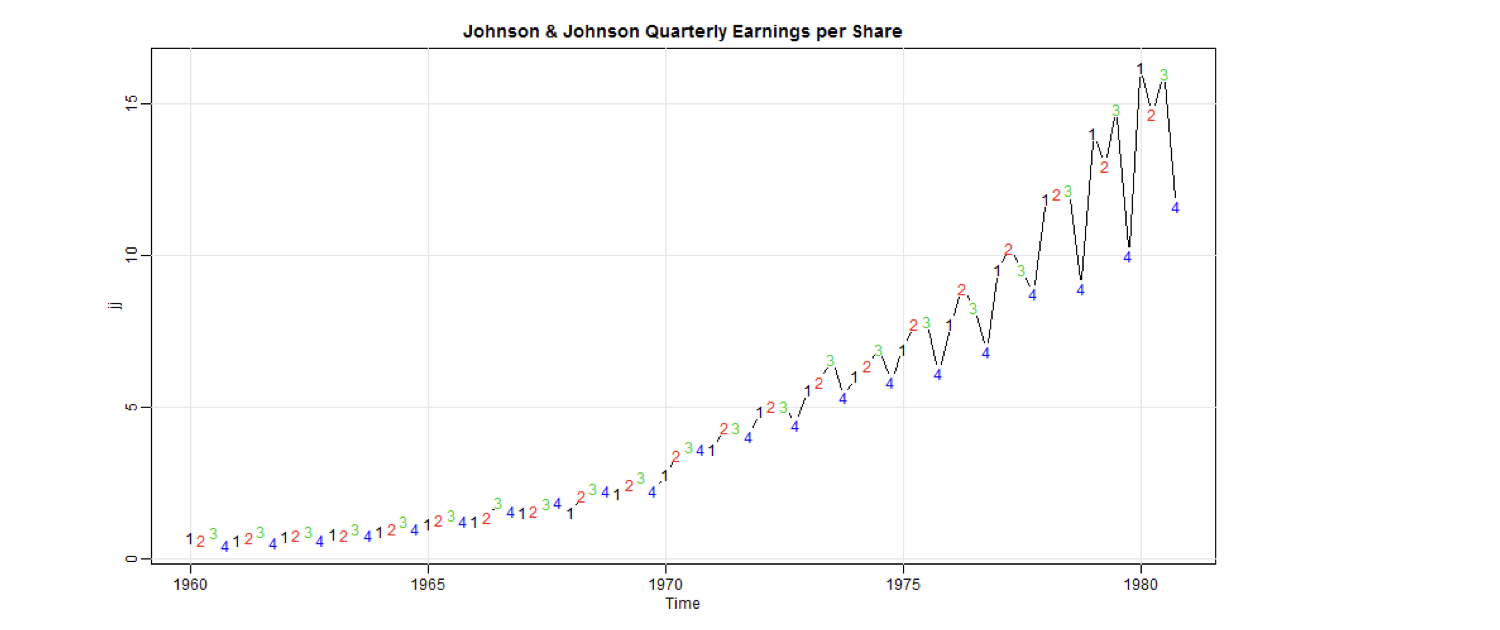
Time Series Data - I
library(astsa)
plot(jj, main = "Johnson & Johnson Quarterly Earnings per Share", type = "c")
text(jj, labels = 1:4, col = 1:4)

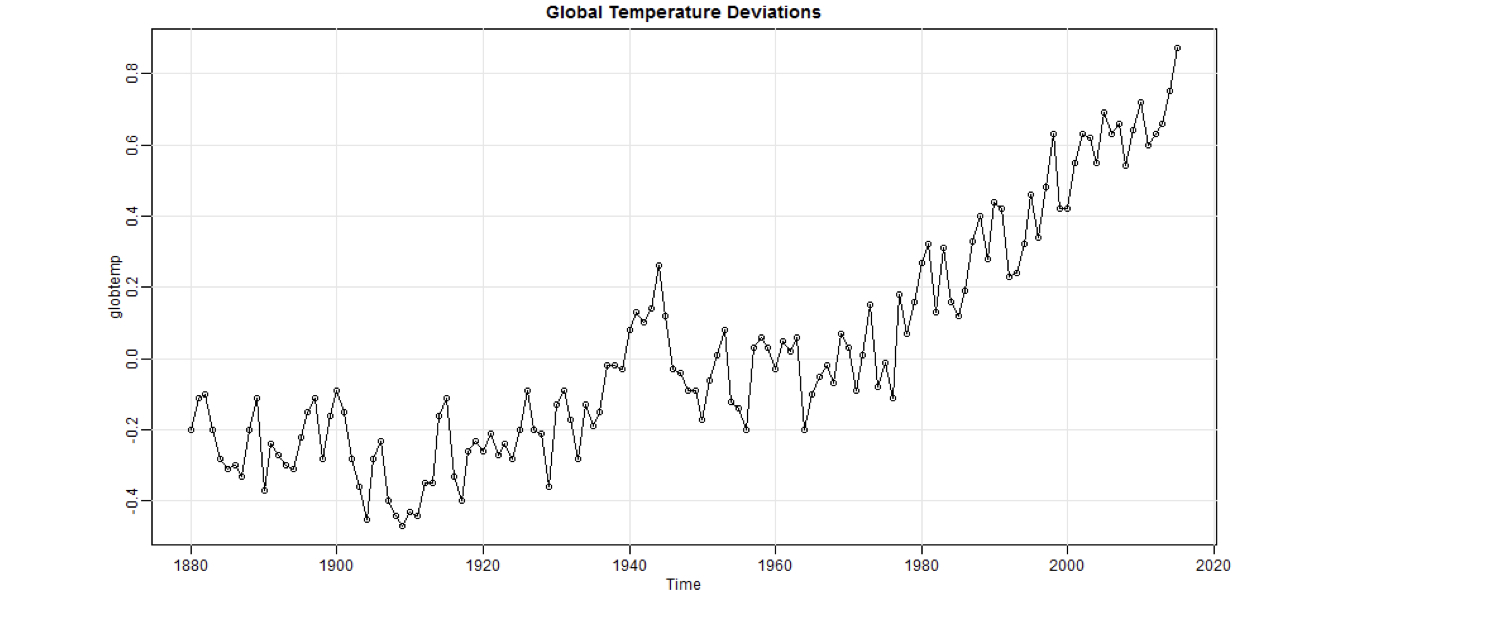
Time Series Data - II
library(astsa)
plot(globtemp, main = "Global Temperature Deviations", type= "o")

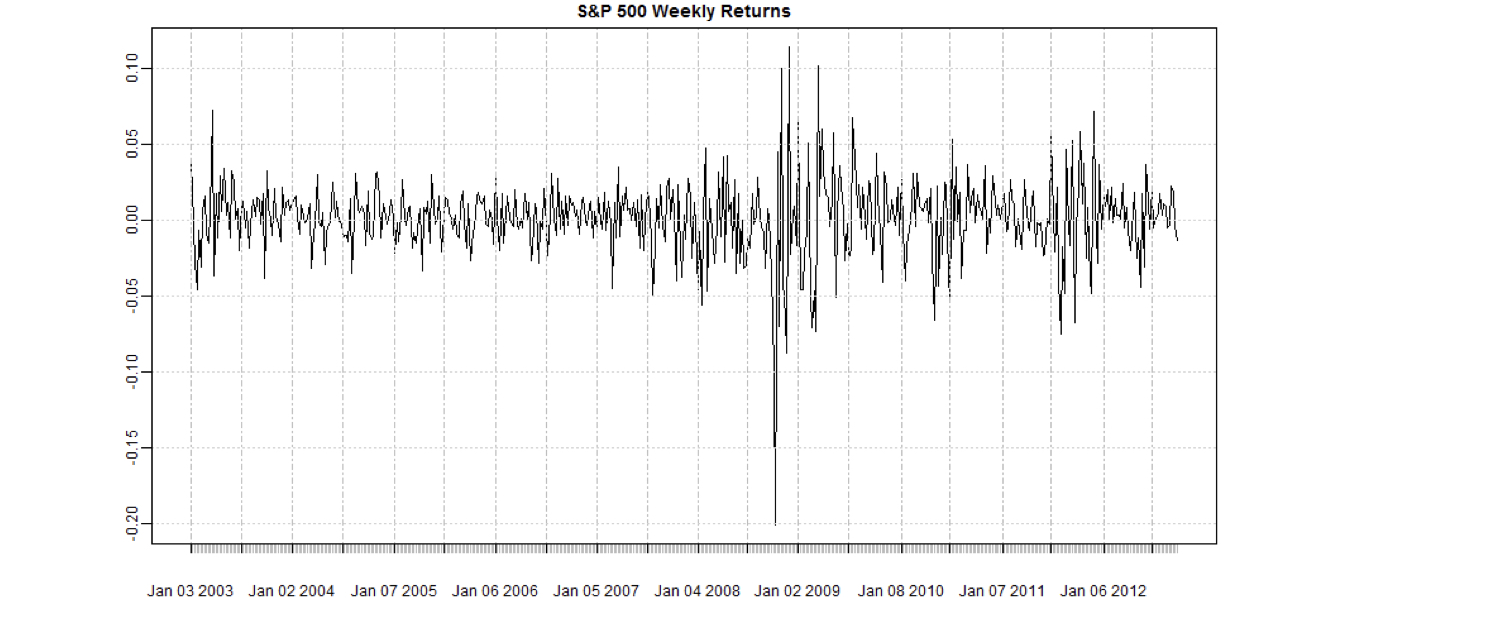
Time Series Data - III
library(xts)
plot(sp500w, main = "S&P 500 Weekly Returns")

Time Series Regression Models
Regression: $Y_i = \beta X_i + \epsilon_i$, where $\epsilon_i$ is white noise
White Noise:
- independent normals with common variance
- is basic building block of time series
AutoRegression: $X_t = \phi X_{t-1} + \epsilon_t \ $ ($\epsilon_t$ is white noise)
Moving Average: $\epsilon_t = W_t + \theta W_{t-1} \ $ ($W_t$ is white noise)
ARMA: $X_t = \phi X_{t-1} + W_t + \theta W_{t-1} \ $
Let's practice!
ARIMA Models in R

