Model choice and residual analysis
ARIMA Models in R

David Stoffer
Professor of Statistics at the University of Pittsburgh
AIC and BIC

AIC and BIC measure the error and penalize (differently) for adding parameters
For example, AIC has $\ k=2$ and BIC has $\ k = log(n)$
Goal: find the model with the smallest AIC or BIC
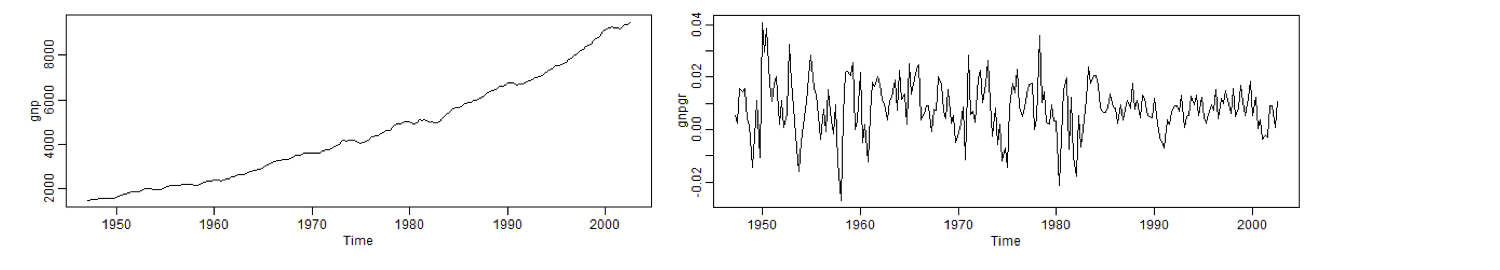
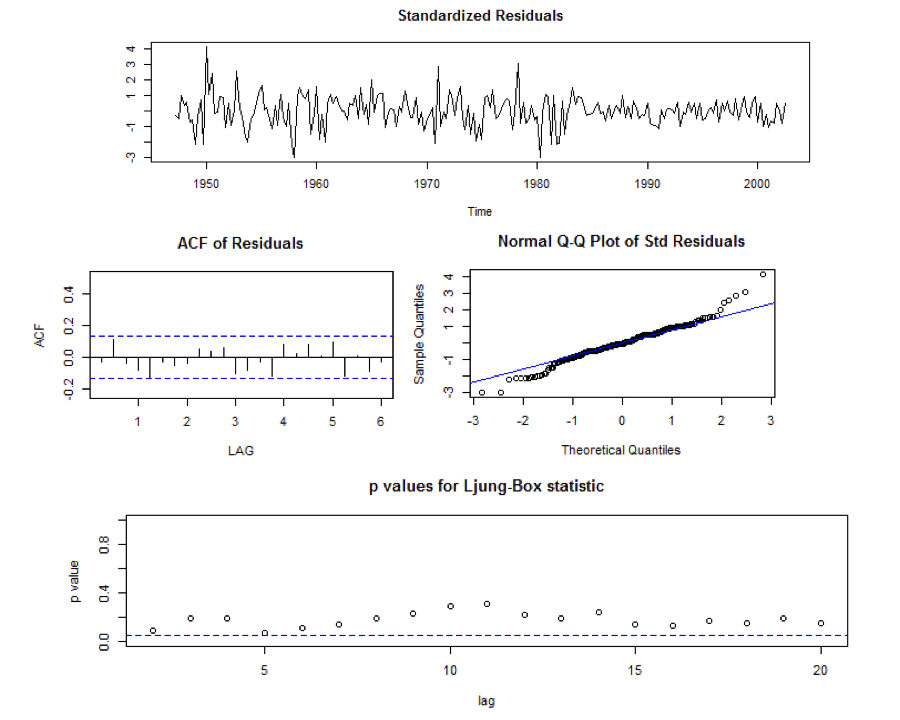
Model Choice: AR(1) vs. MA(2)
gnpgr <- diff(log(gnp))
sarima(gnpgr, p = 1, d = 0, q = 0)
$AIC                          $BIC
-8.294403                     -9.263748
sarima(gnpgr, p = 0, d = 0, q = 2)
$AIC                          $BIC
-8.297695                     -9.251712
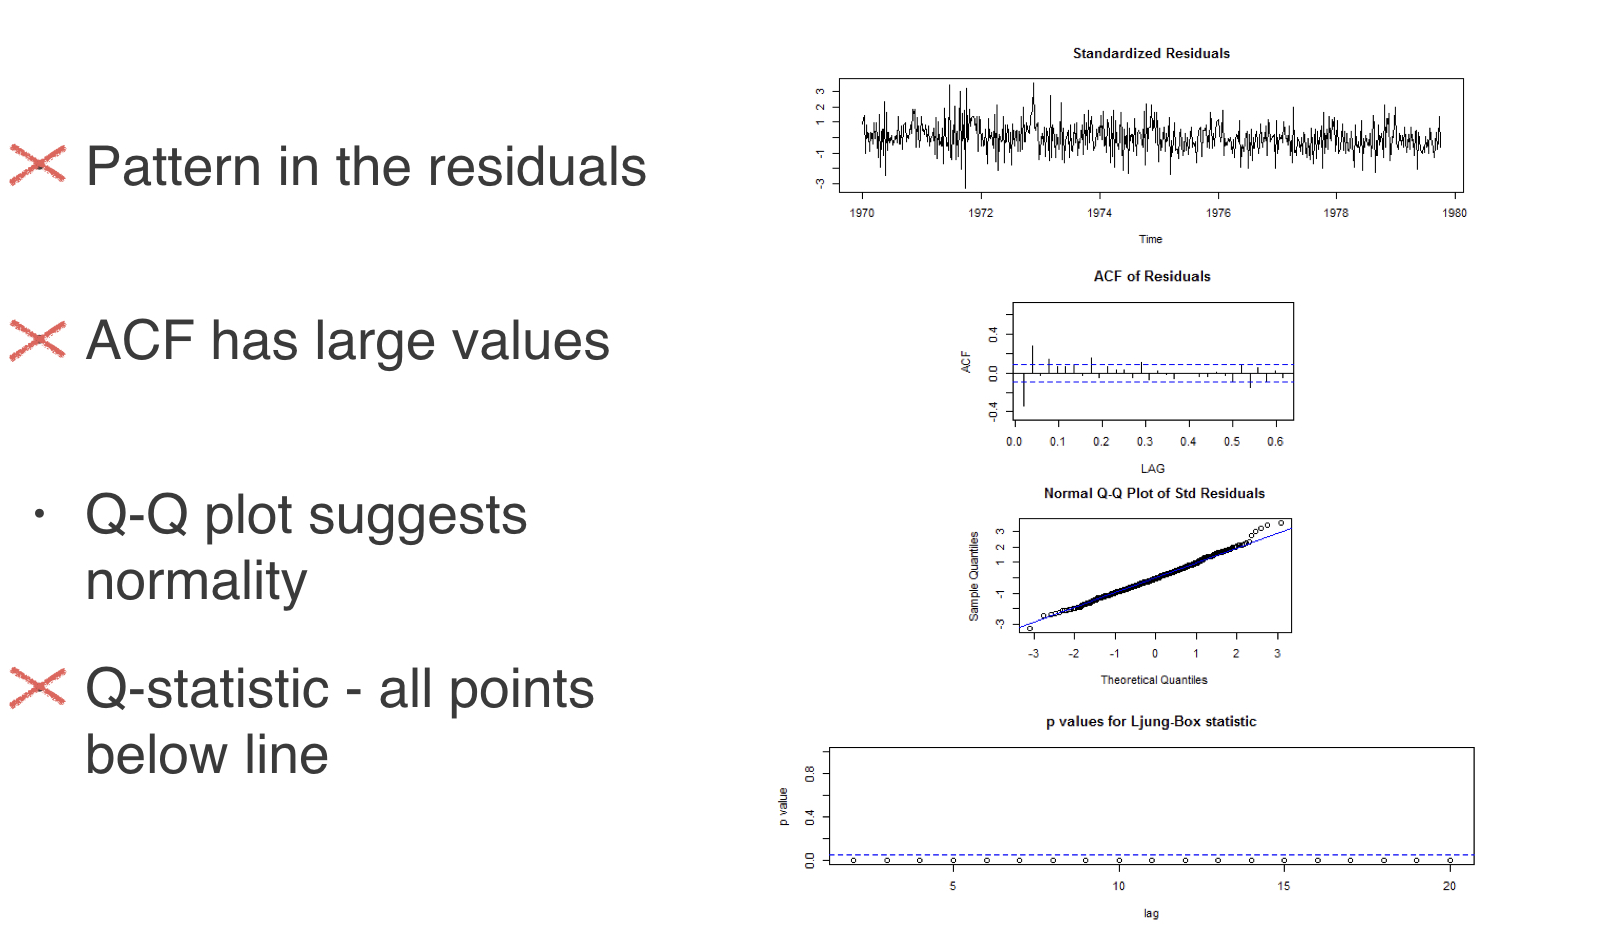
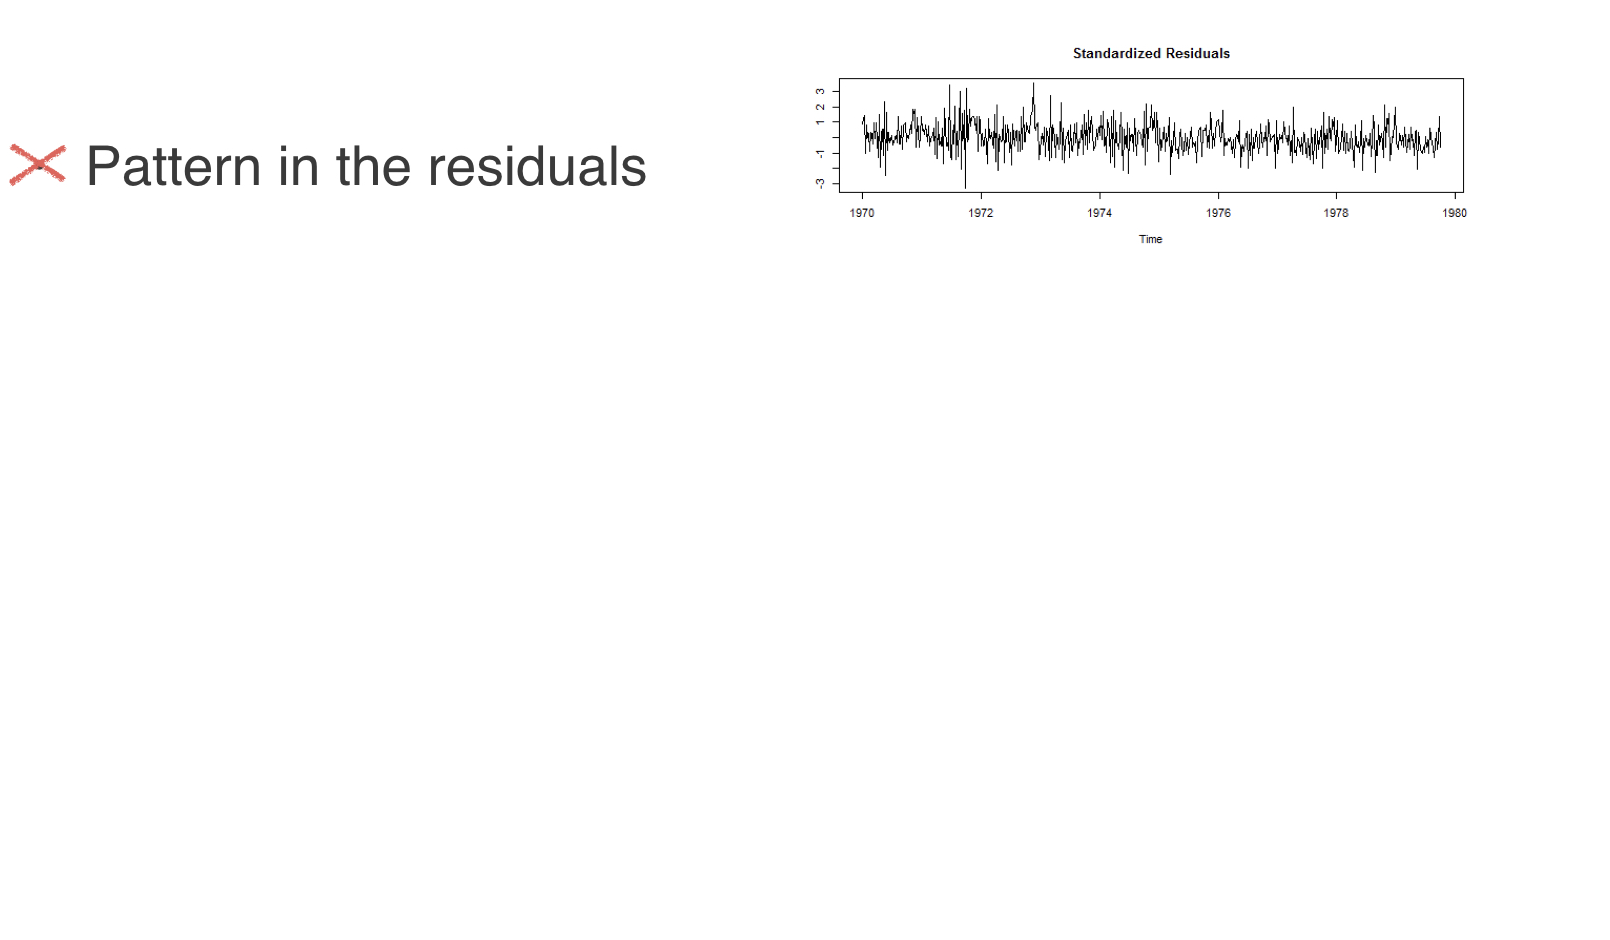
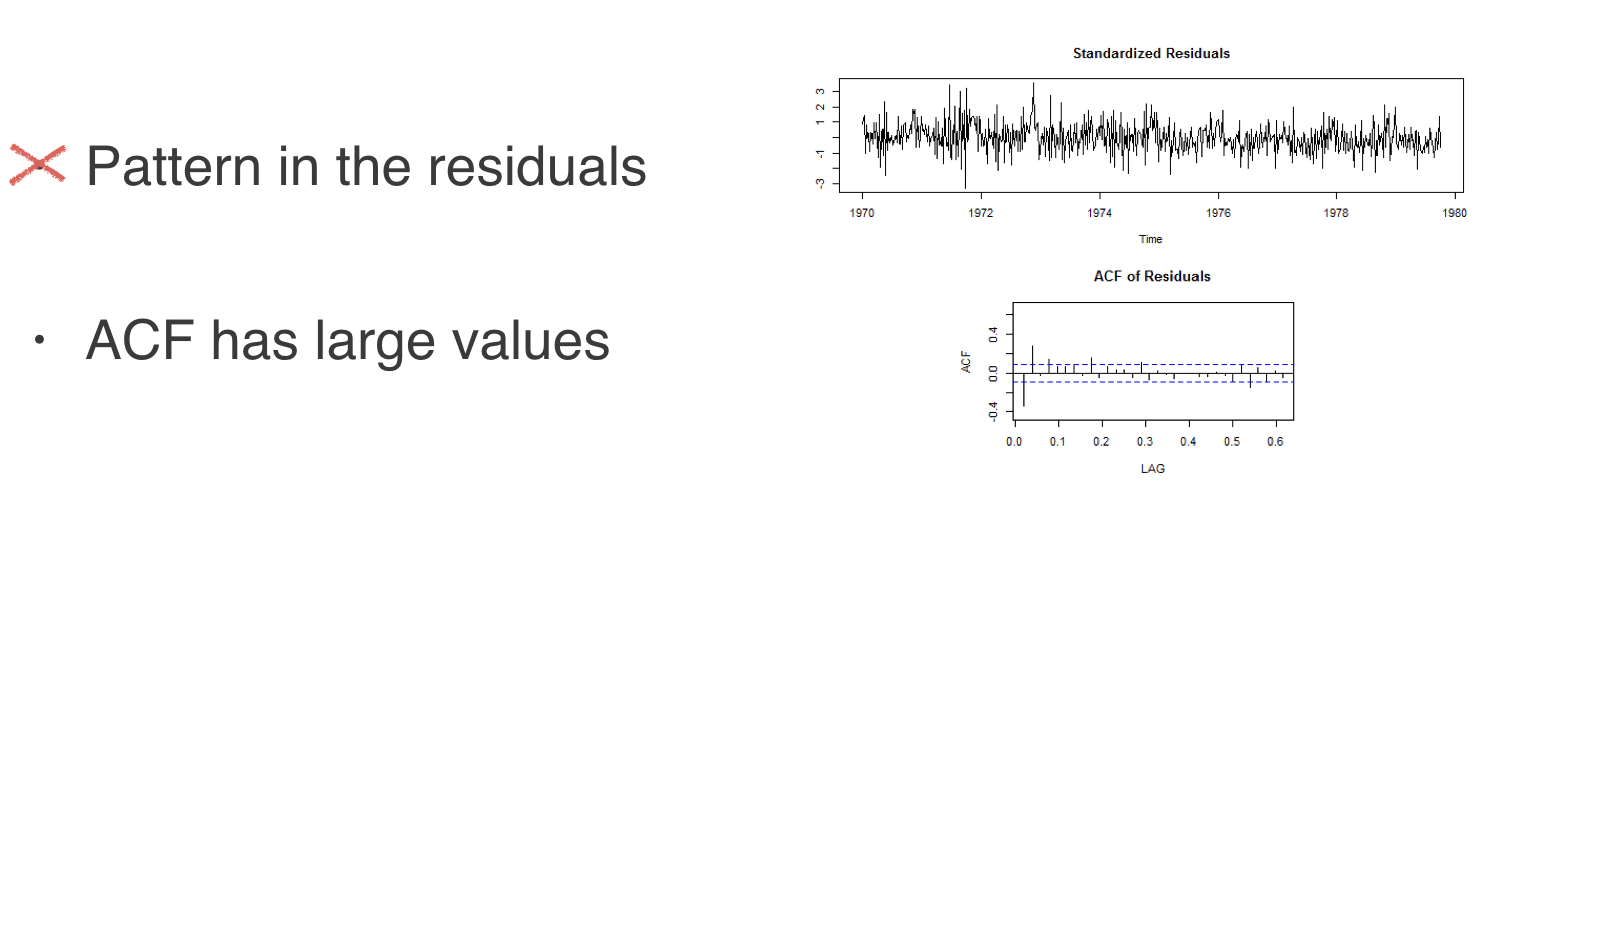
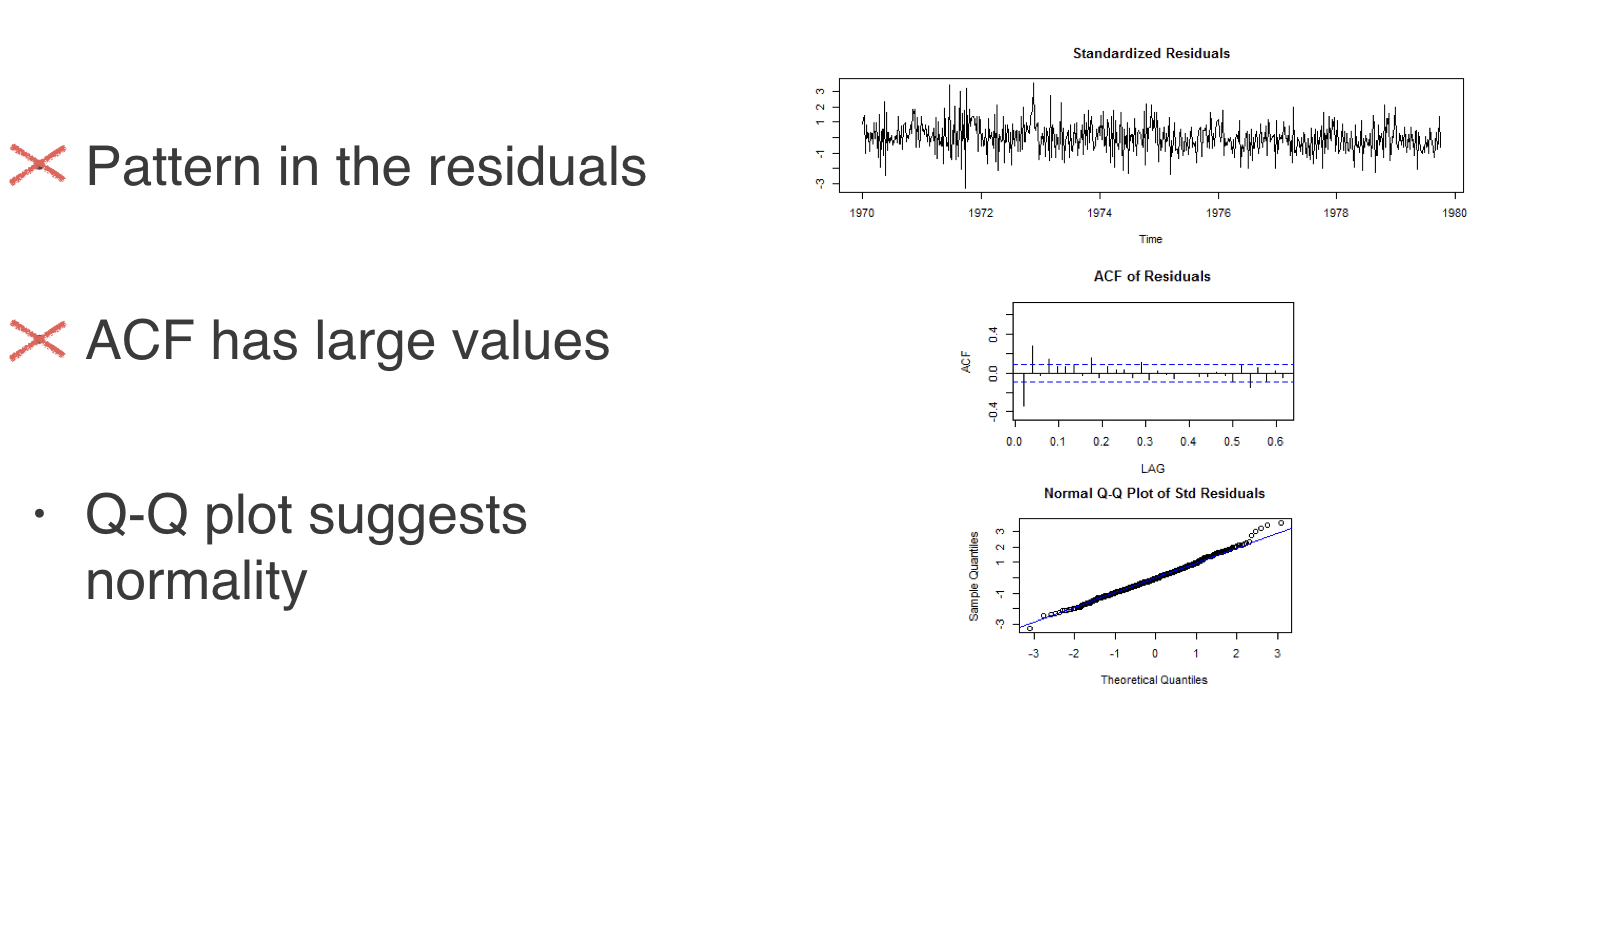
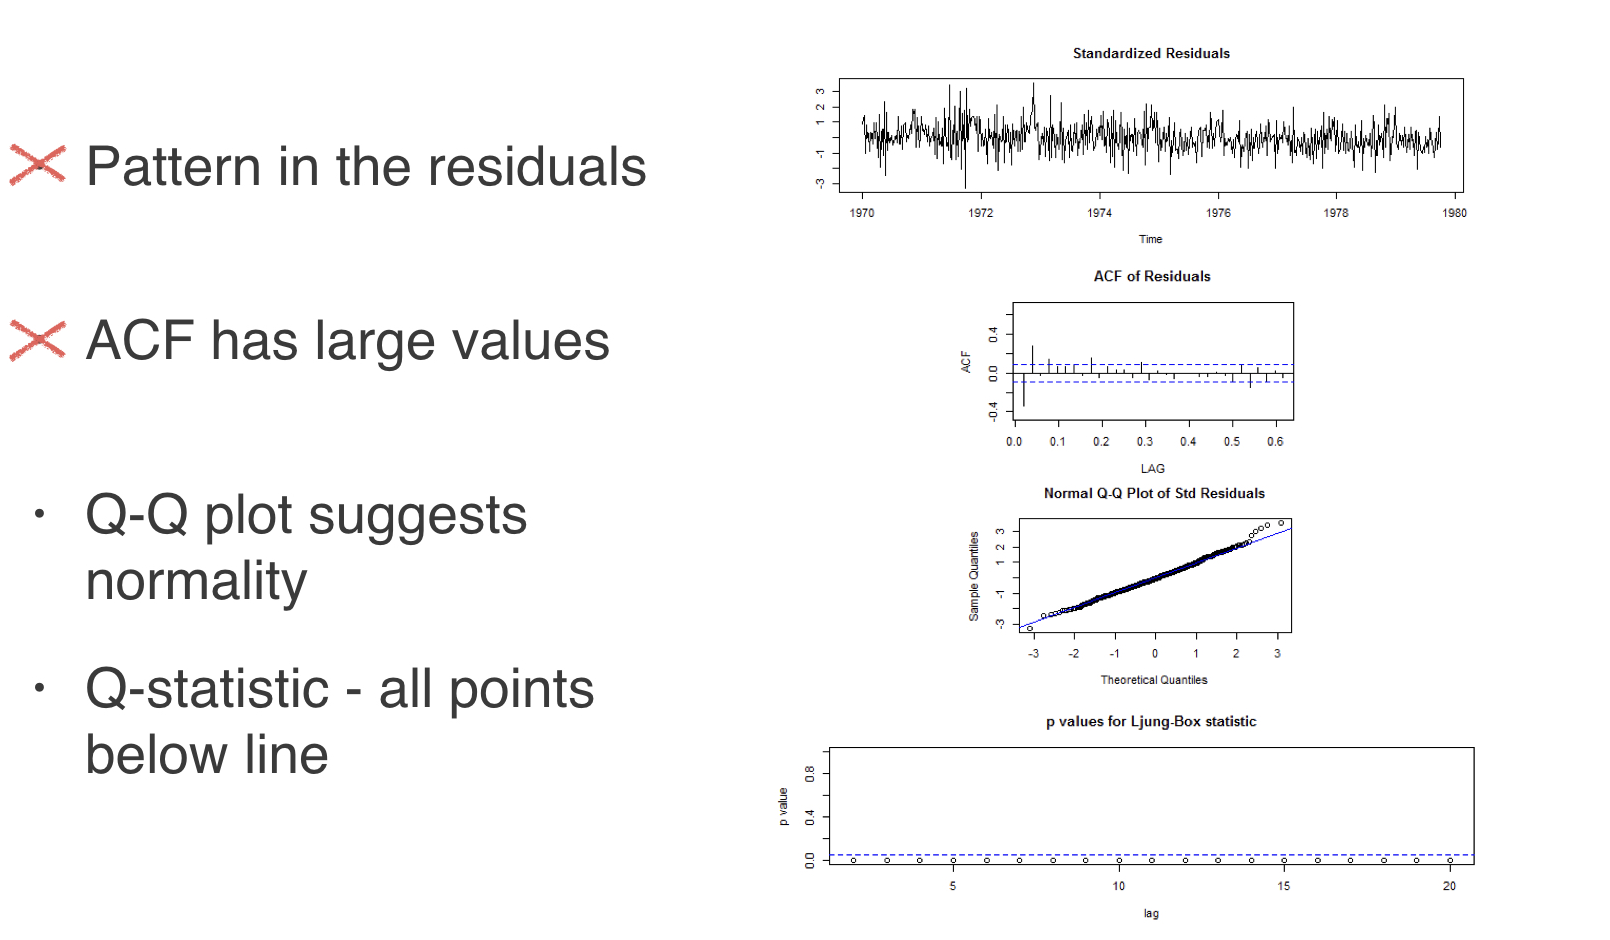
Residual Analysis
Bad Residuals
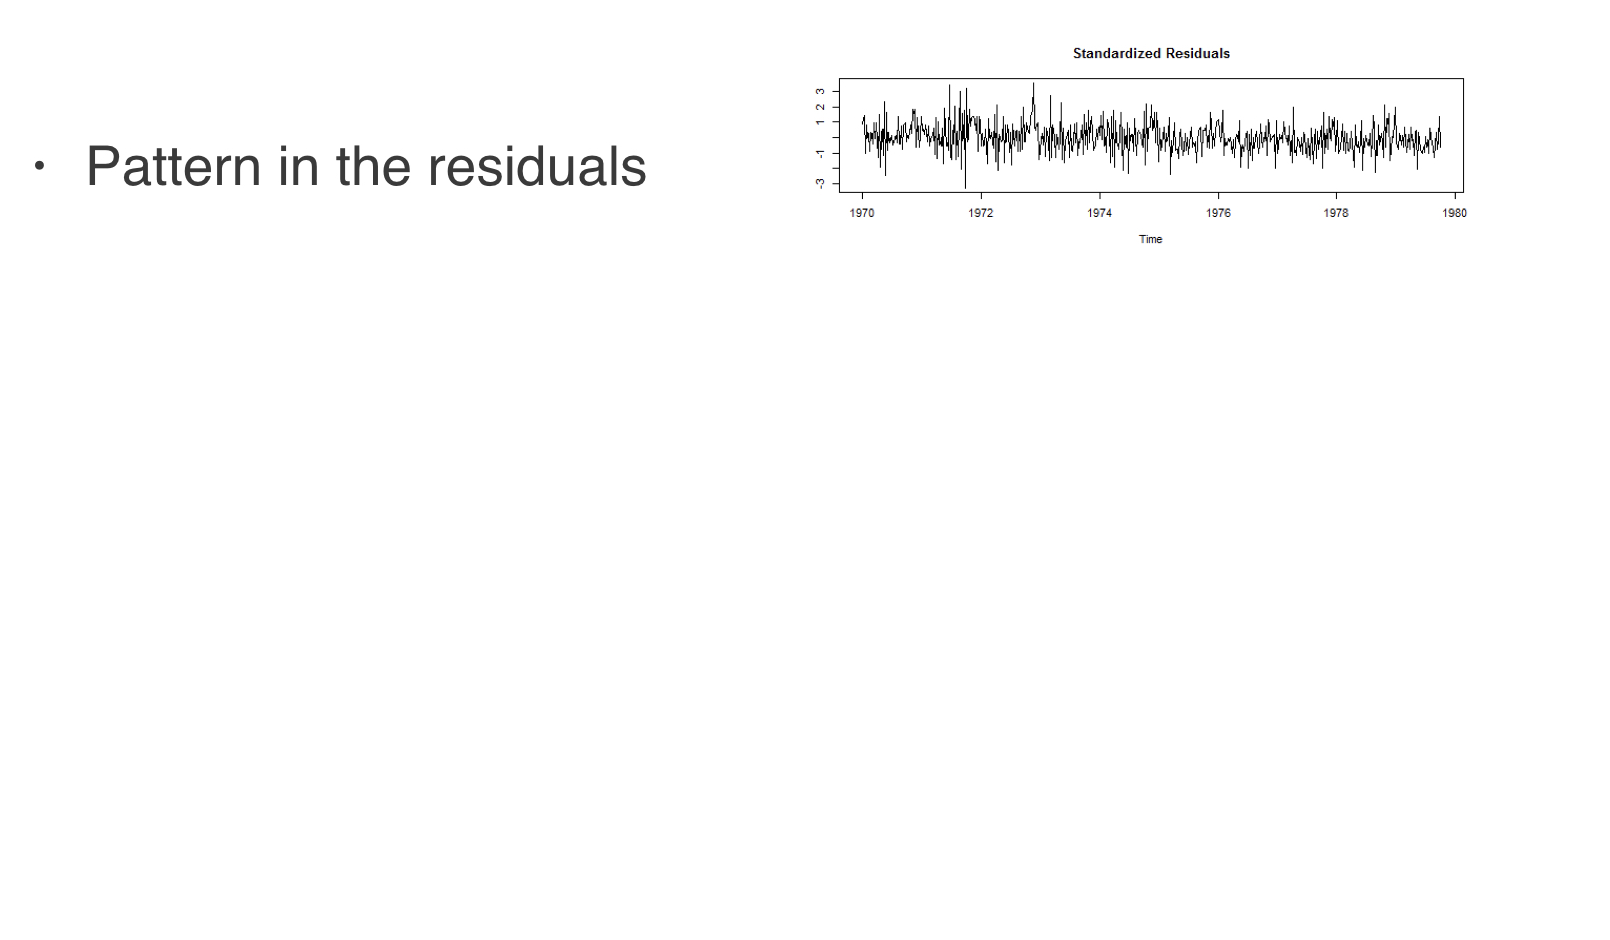
Bad Residuals
Bad Residuals
Bad Residuals

Bad Residuals
Bad Residuals
Bad Residuals