Stationarity and nonstationarity
ARIMA Models in R

David Stoffer
Professor of Statistics at the University of Pittsburgh
Stationarity
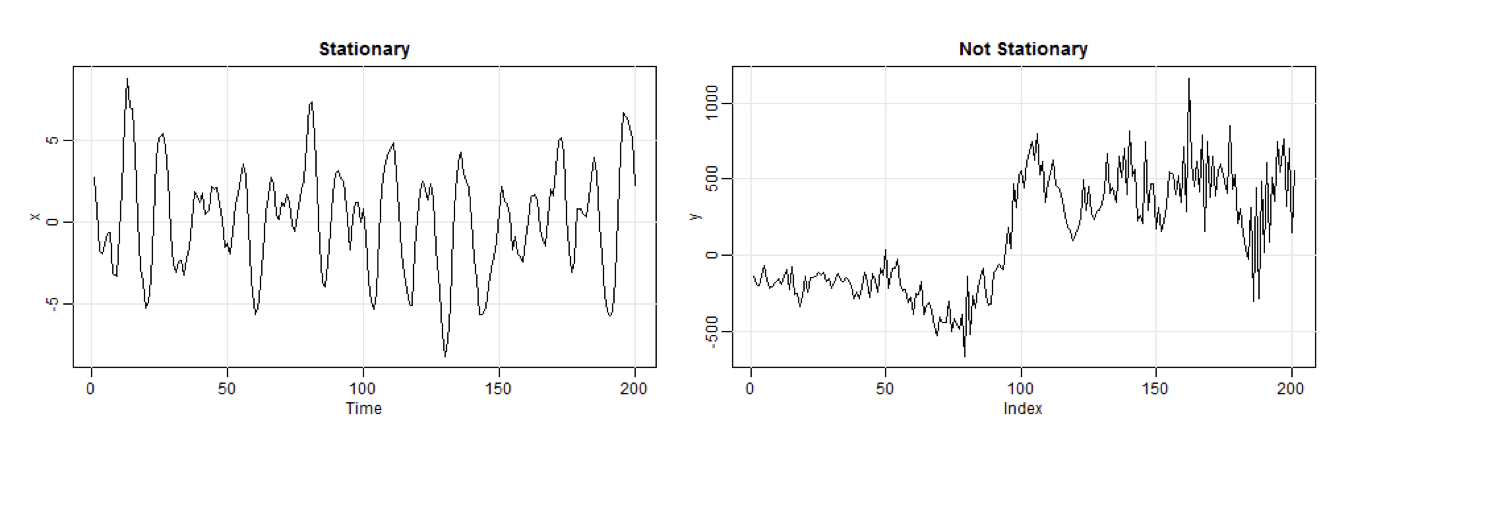
A time series is stationary when it is "stable", meaning:
- the mean is constant over time (no trend)
- the correlation structure remains constant over time
Southern Oscillation Index
Reasonable to assume stationary, but perhaps some slight trend.
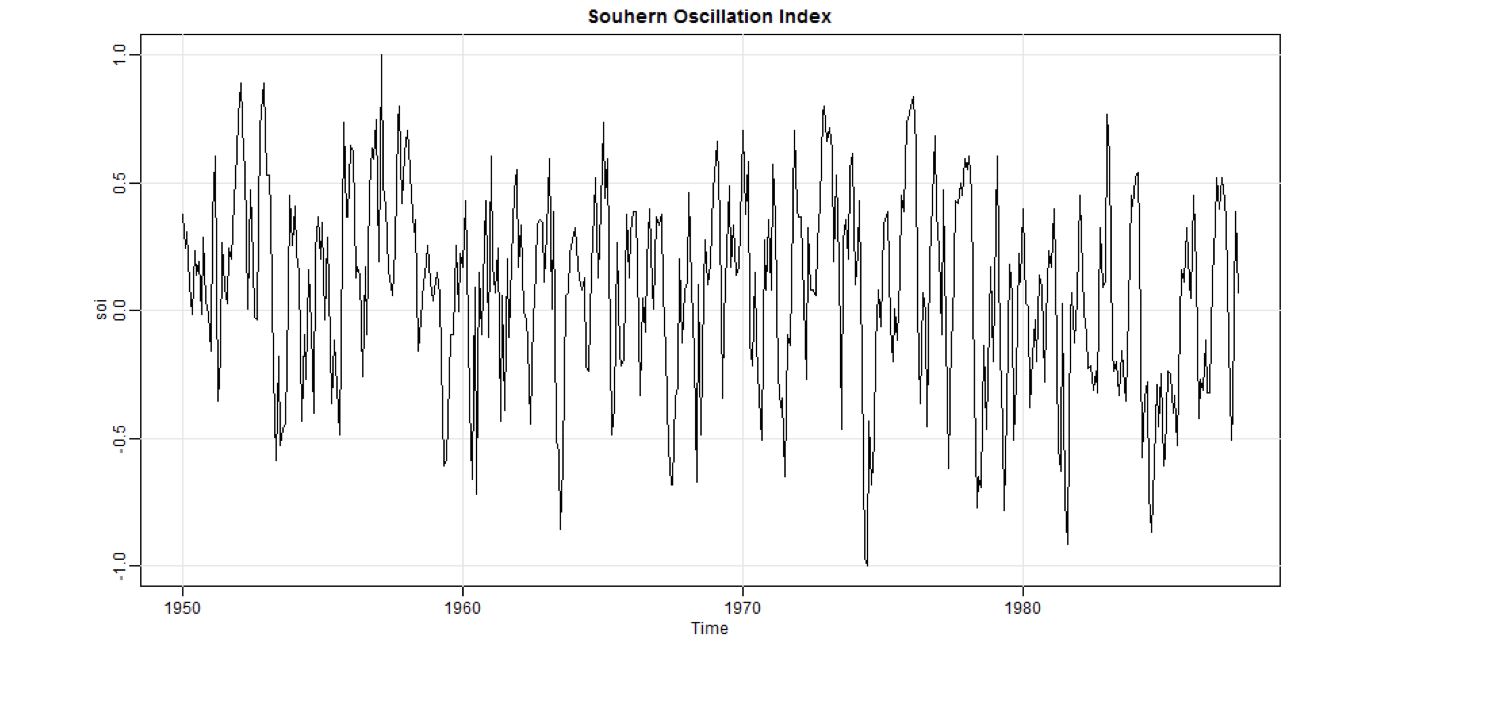
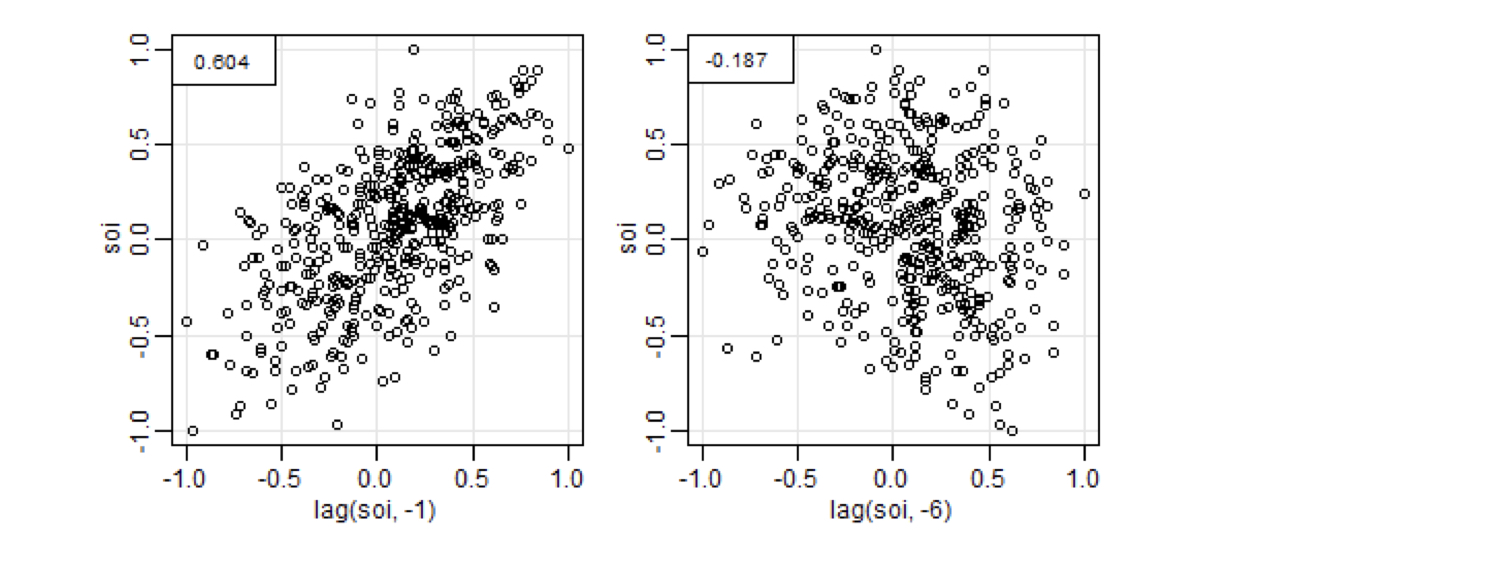
Southern Oscillation Index
To estimate autocorrelation, compute the correlation coefficient between the time series and itself at various lags.
Here you see how to get the correlation at lag 1 and lag 6.
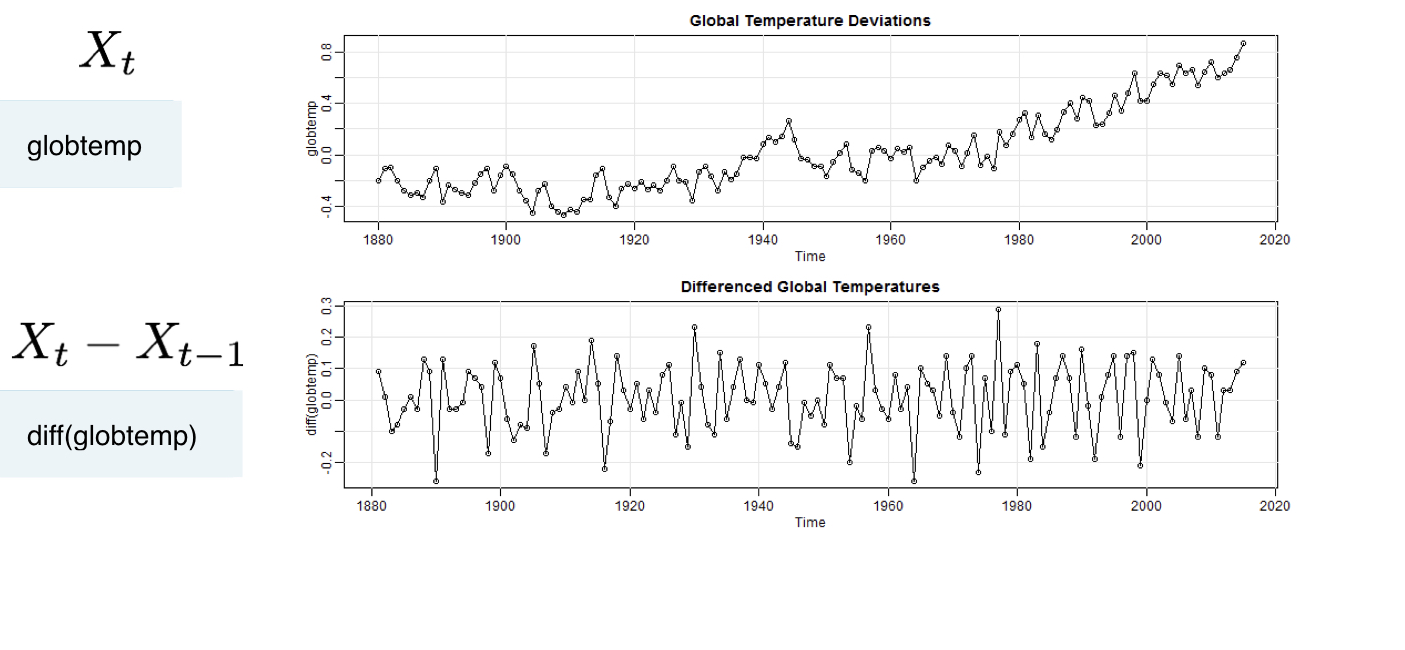
Random Walk Trend
Not stationary, but differenced data are stationary.
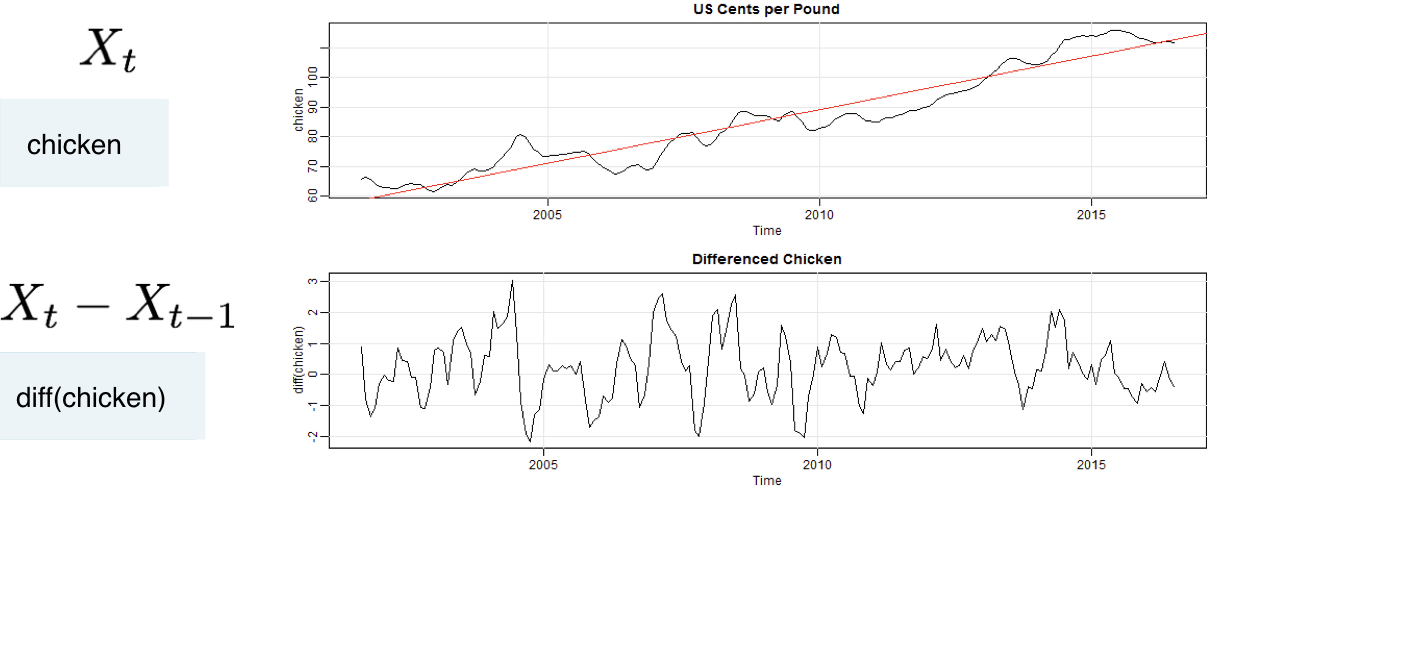
Trend Stationarity
Stationarity around a trend, differencing still works!
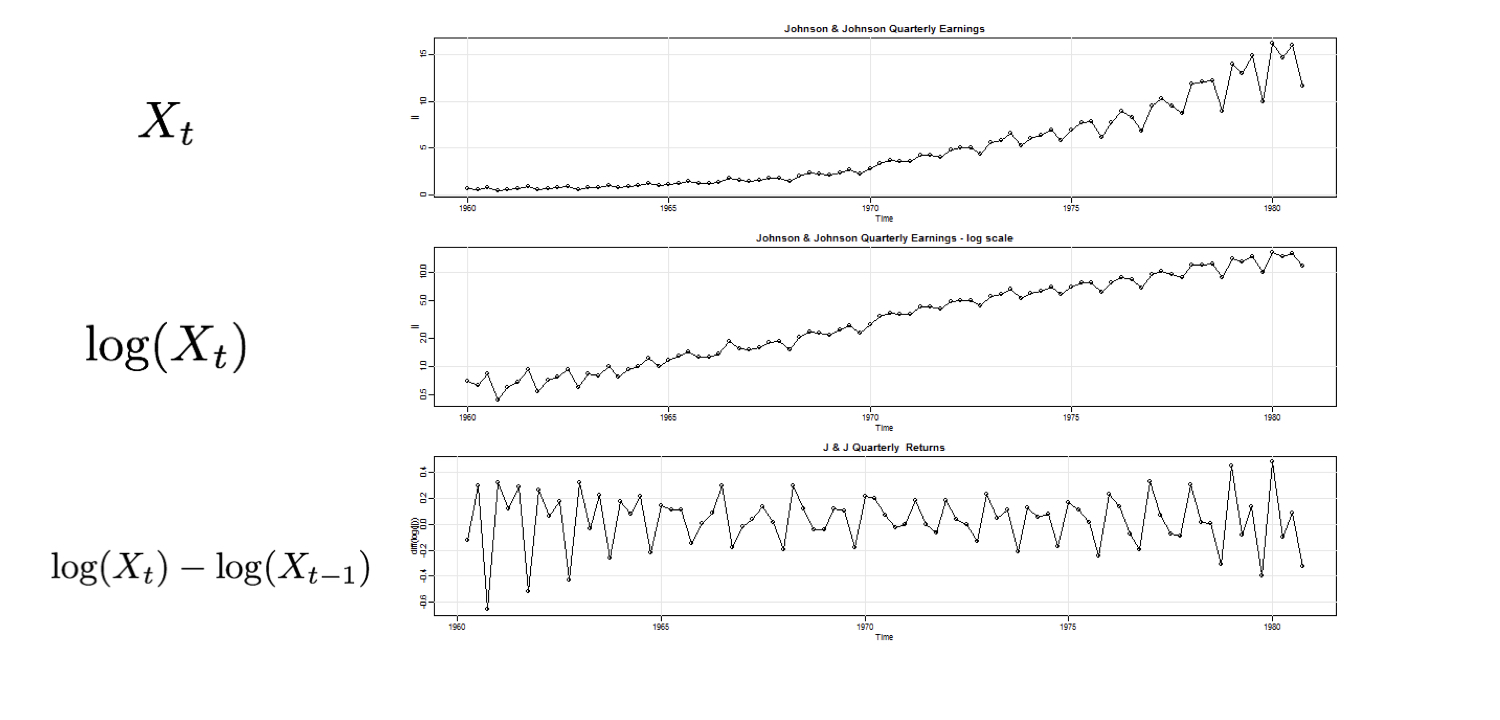
Nonstationarity in trend and variability
First log, then difference