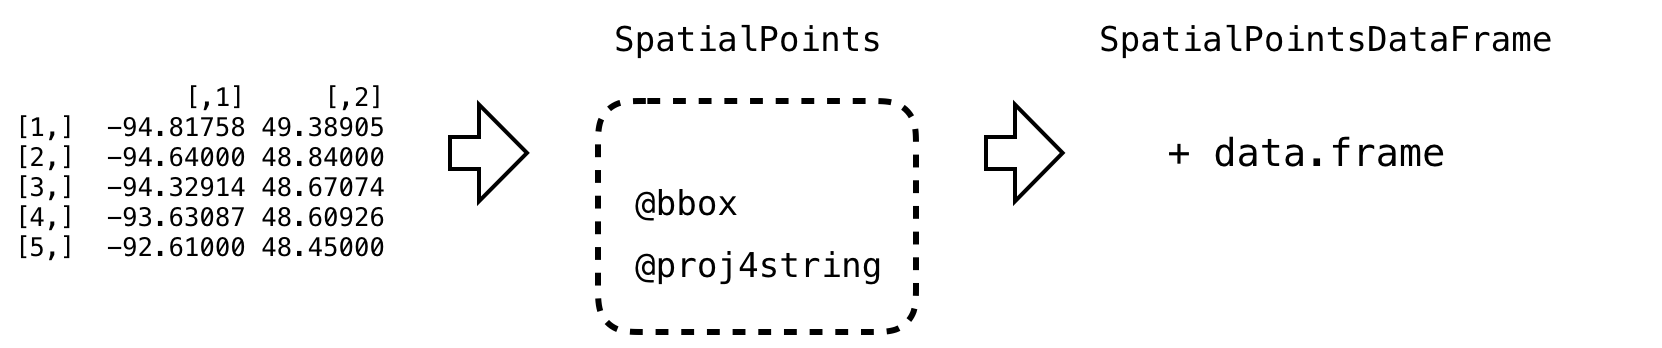
More sp classes and methods
Visualizing Geospatial Data in R

Charlotte Wickham
Assistant Professor at Oregon State University
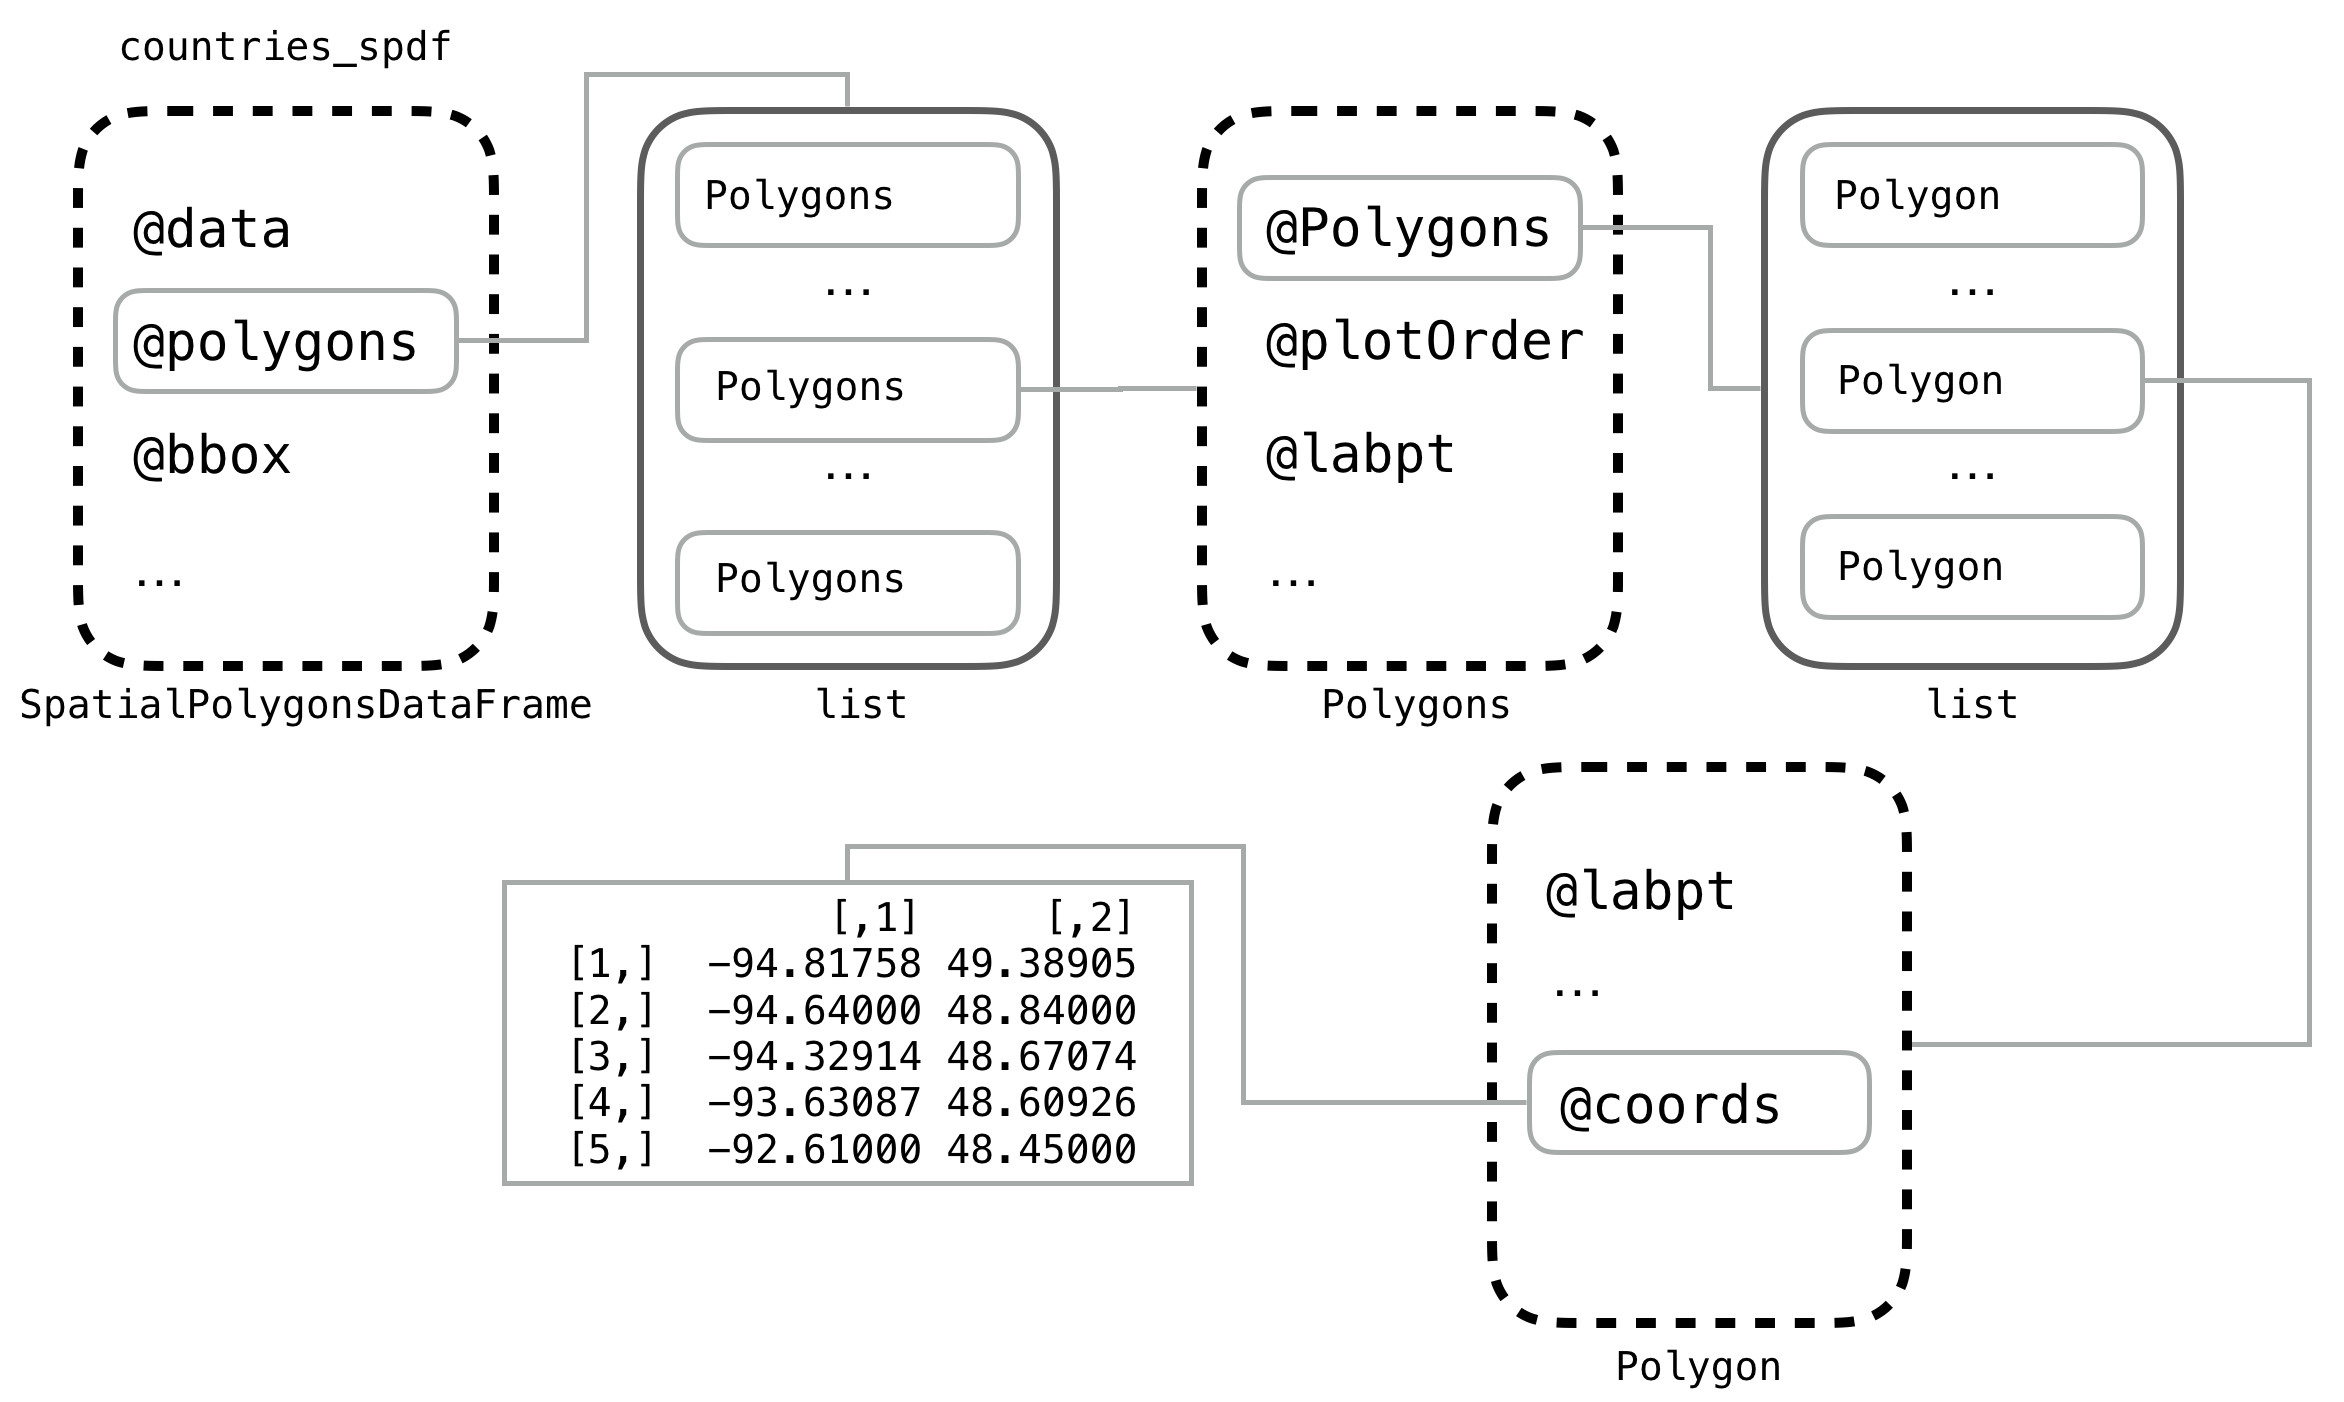
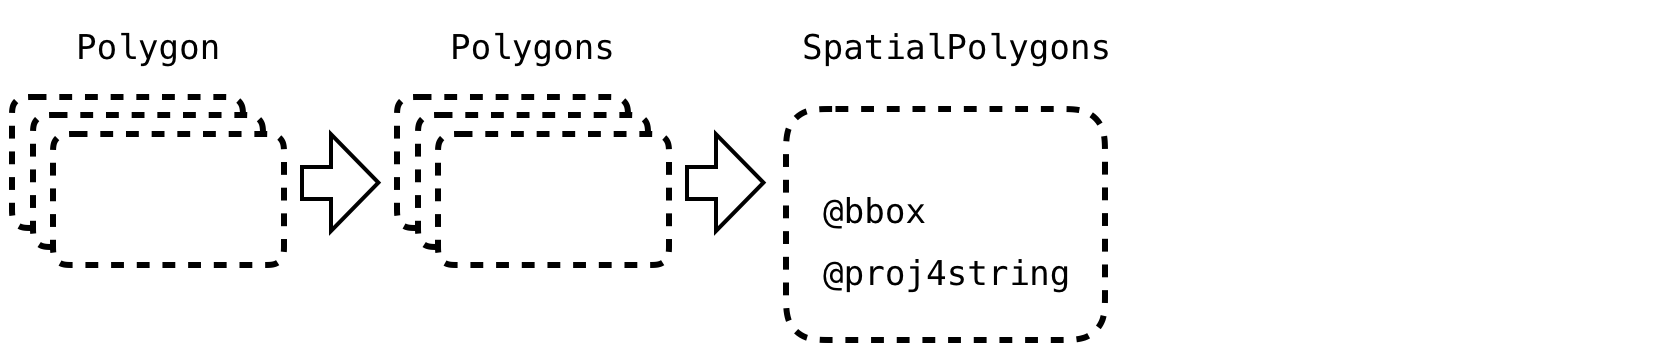
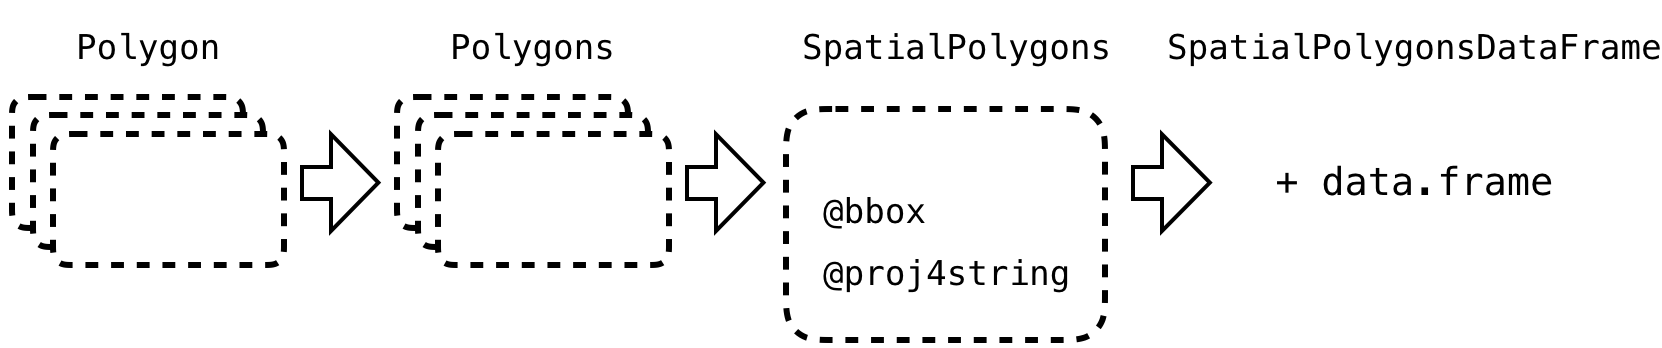
Hierarchy of SpatialPolygonsDataFrame
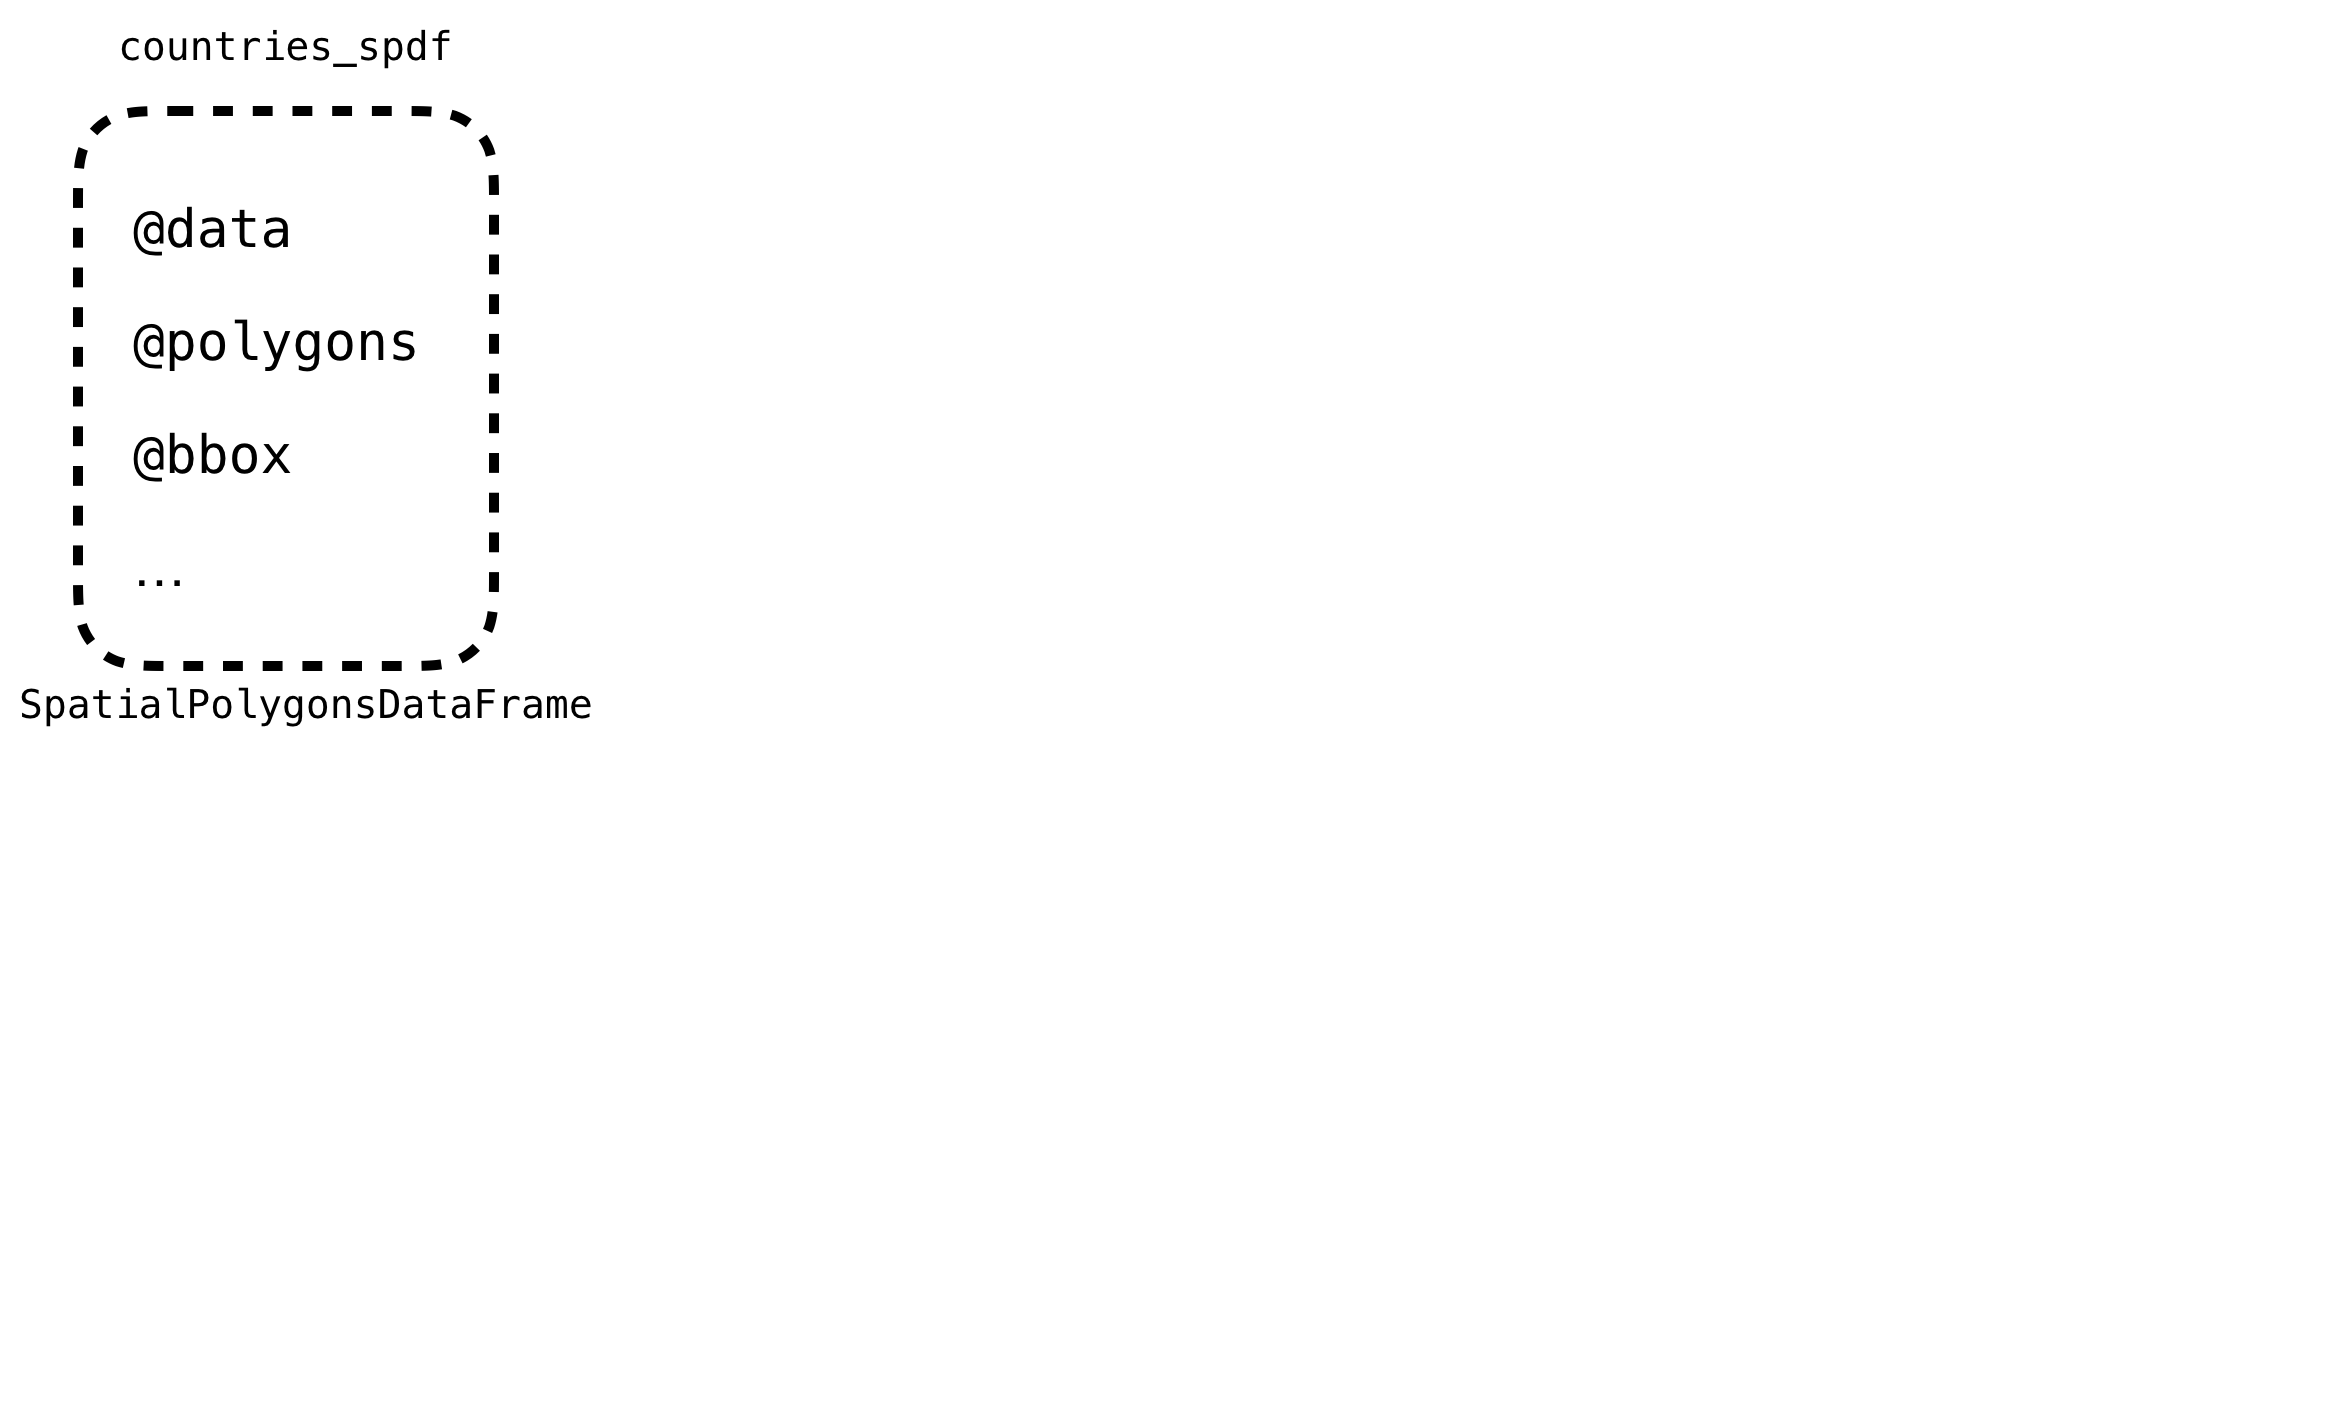
Hierarchy of SpatialPolygonsDataFrame
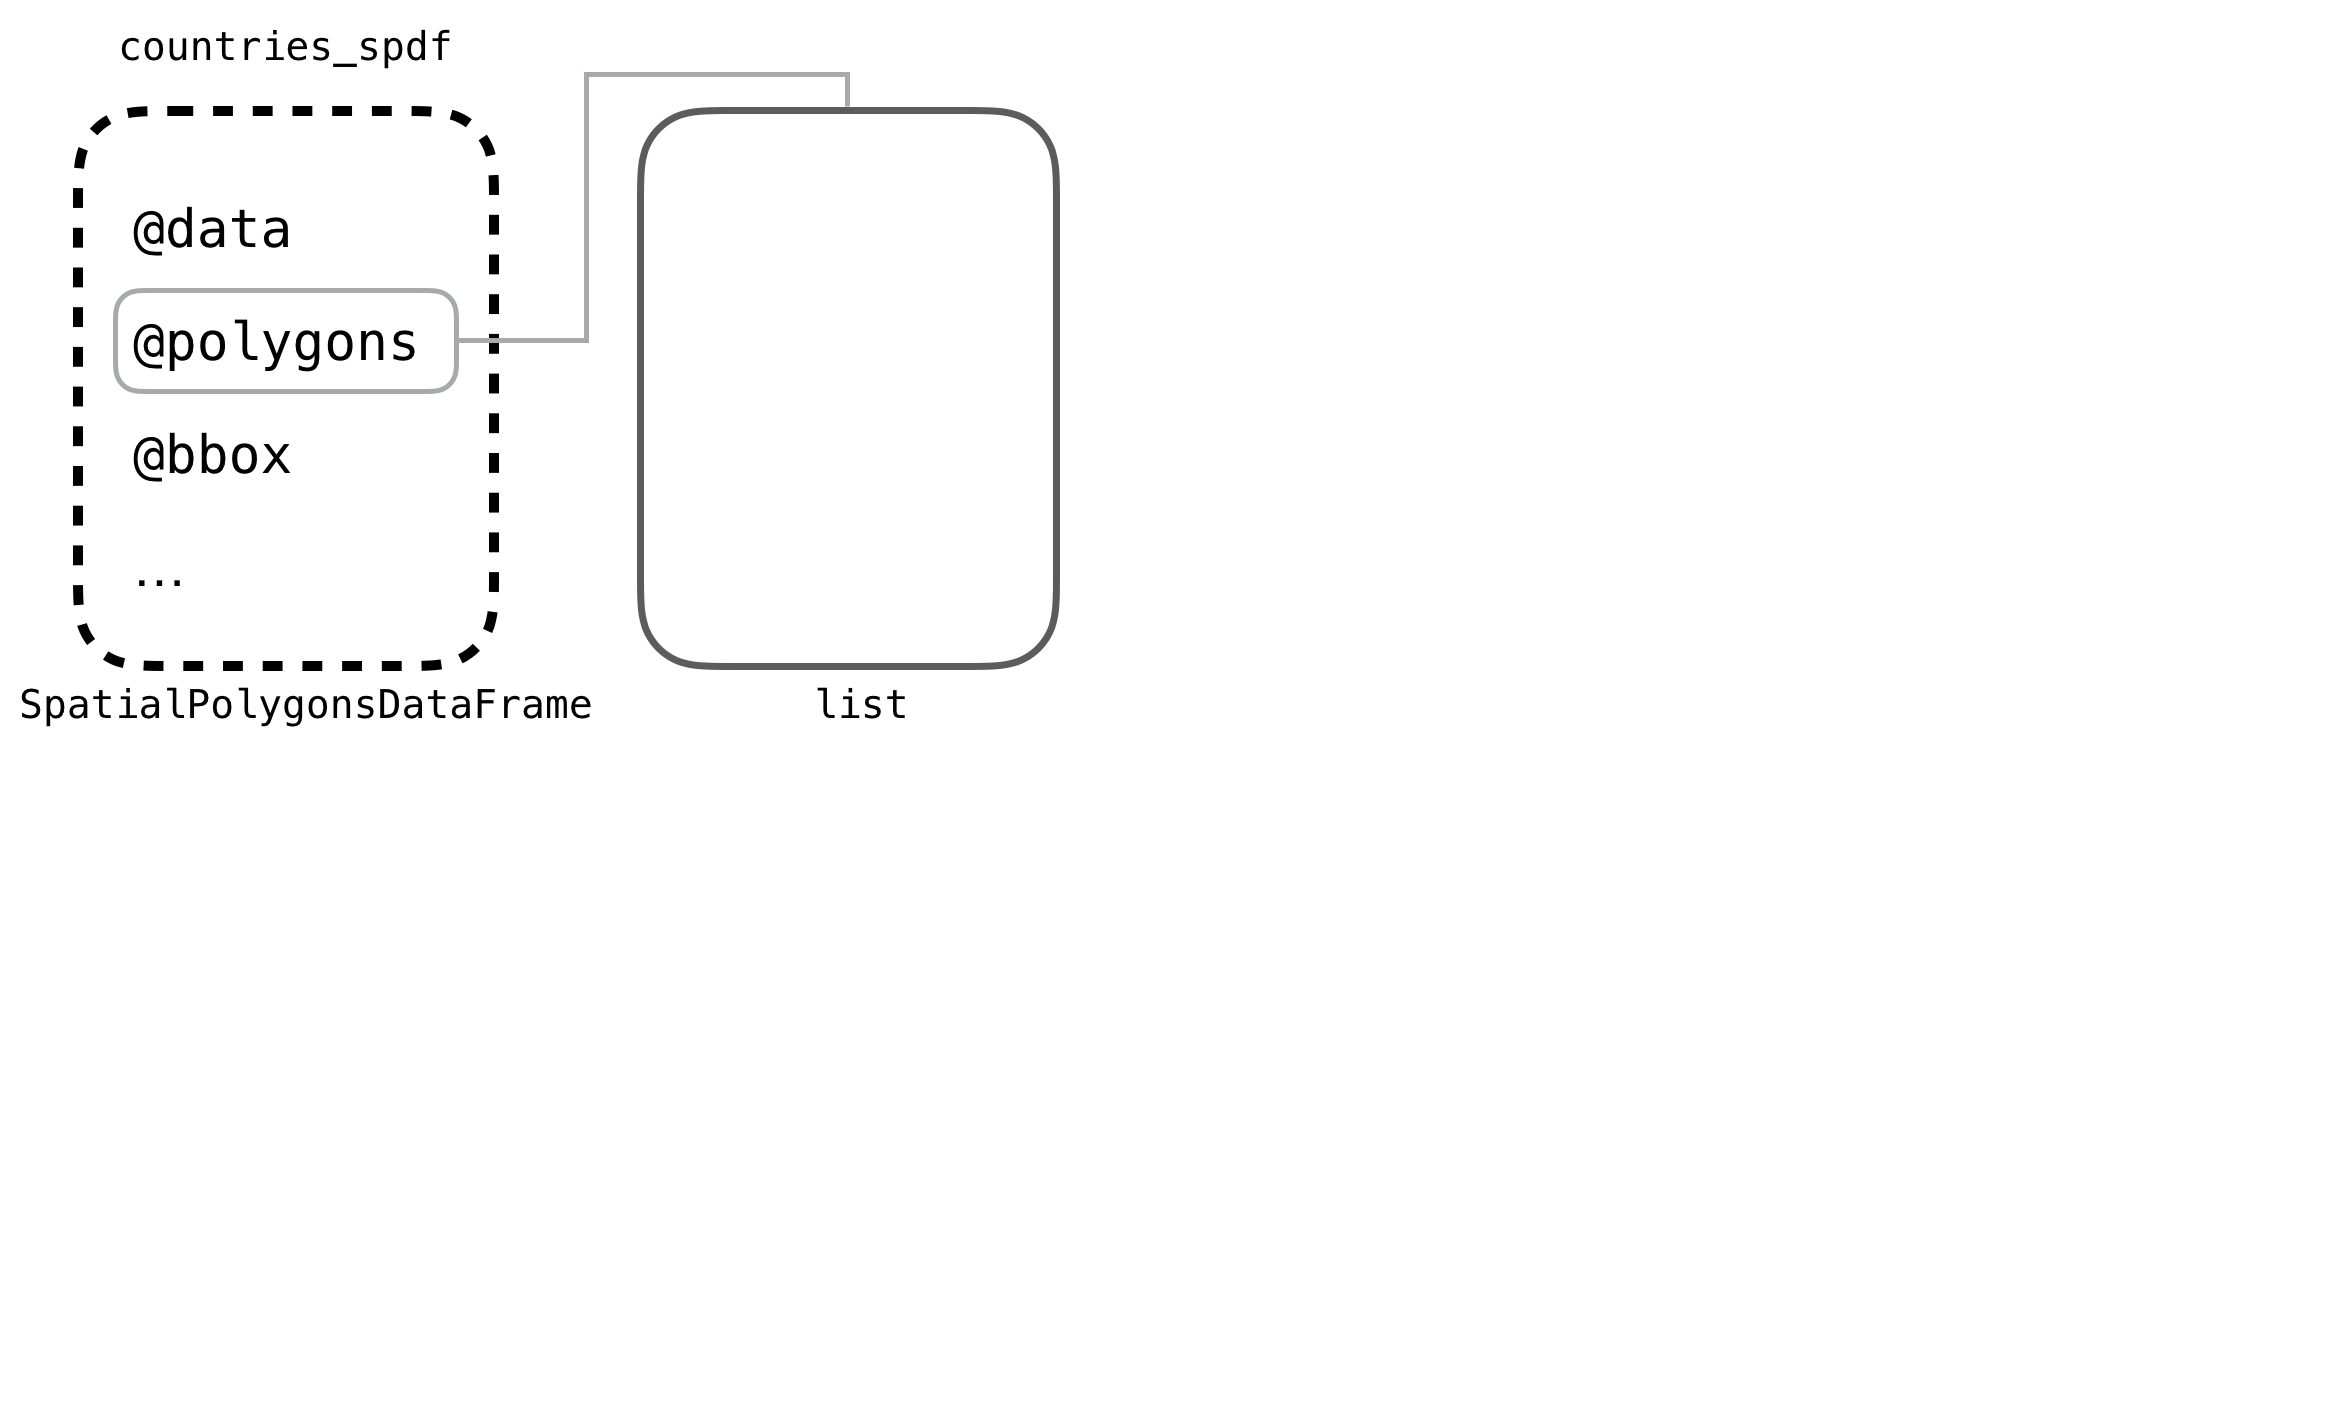
Hierarchy of SpatialPolygonsDataFrame
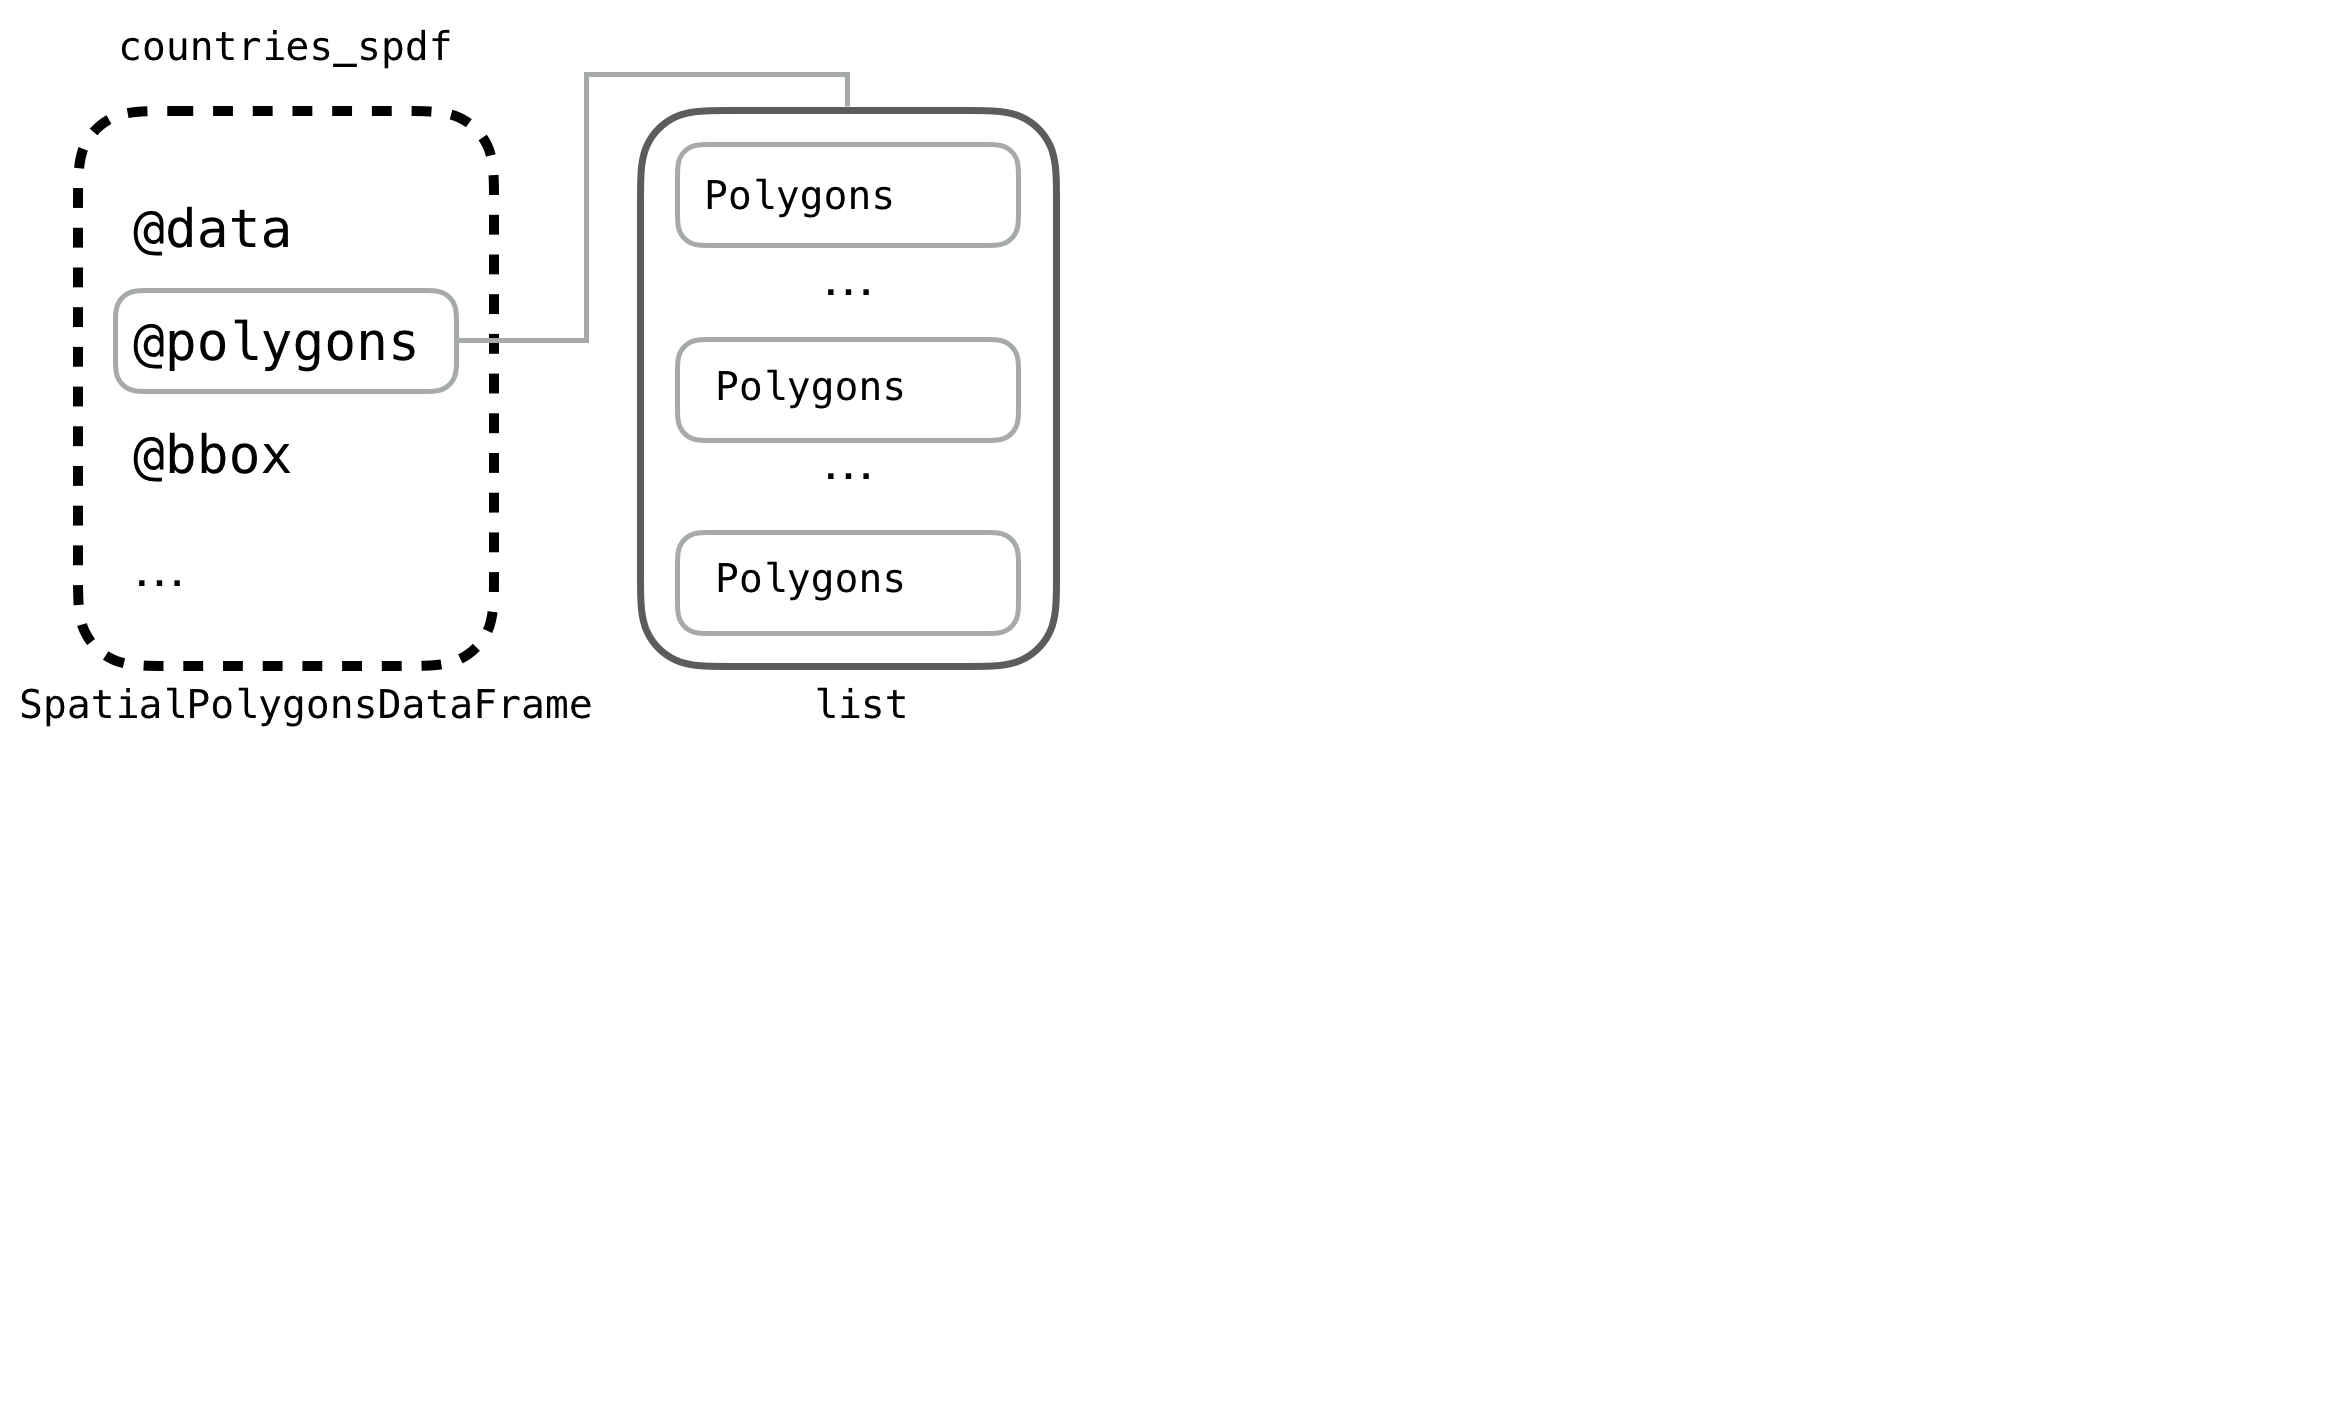
Hierarchy of SpatialPolygonsDataFrame
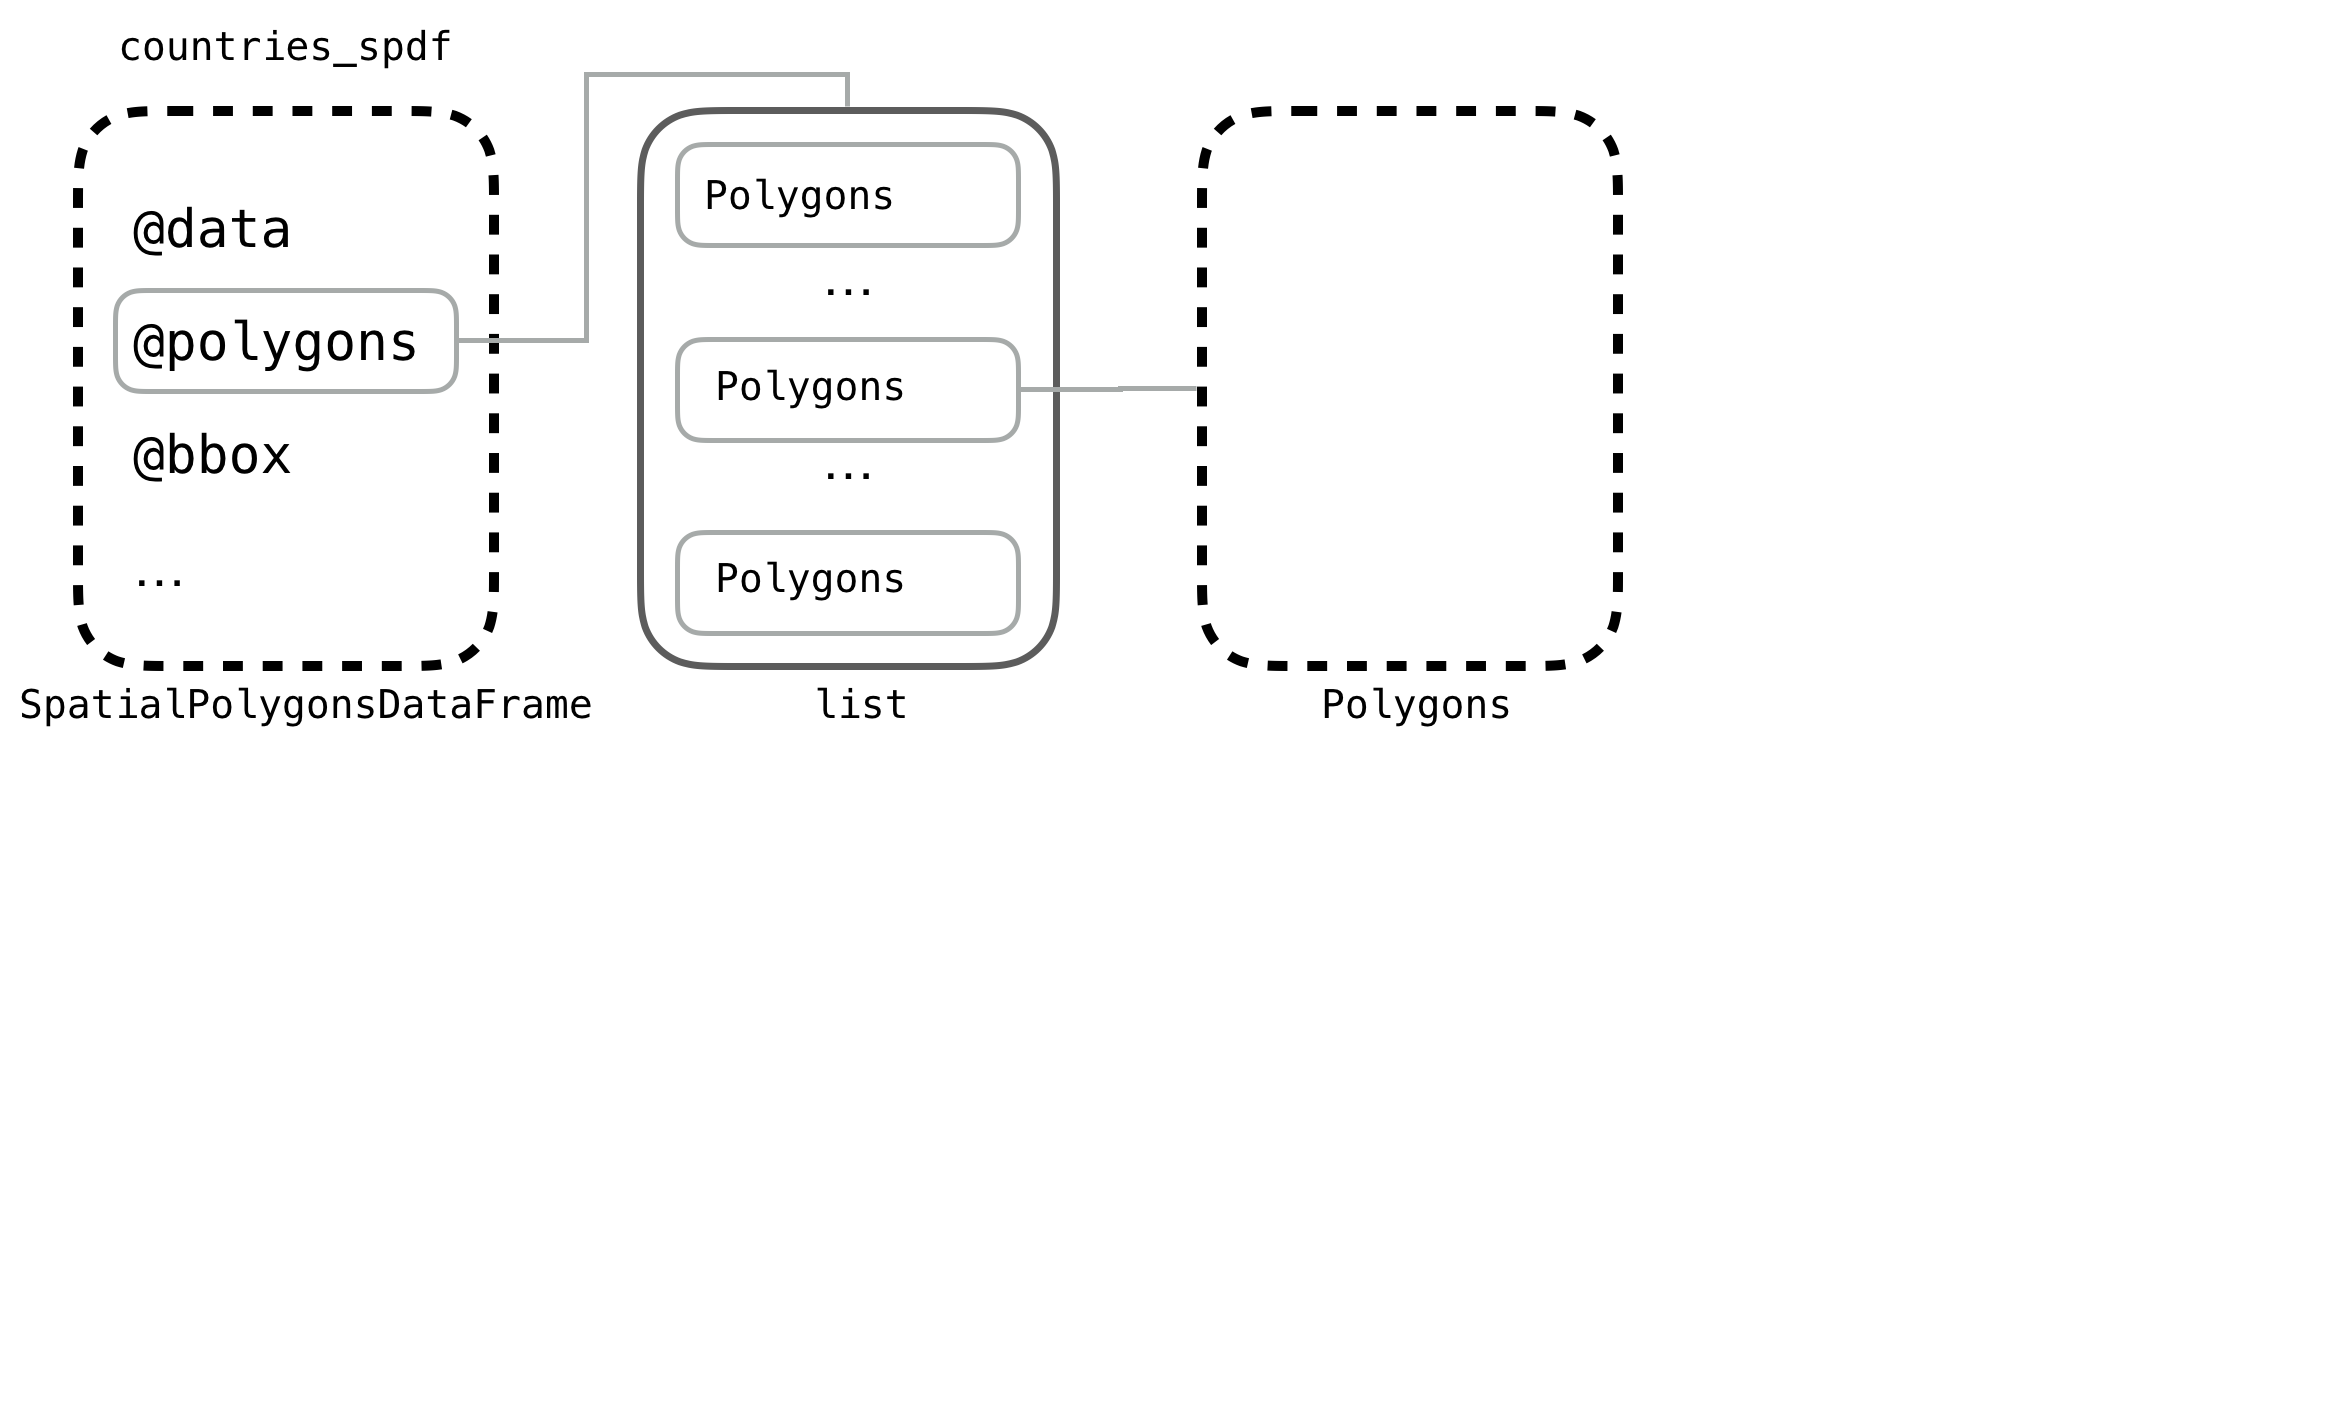
Hierarchy of SpatialPolygonsDataFrame
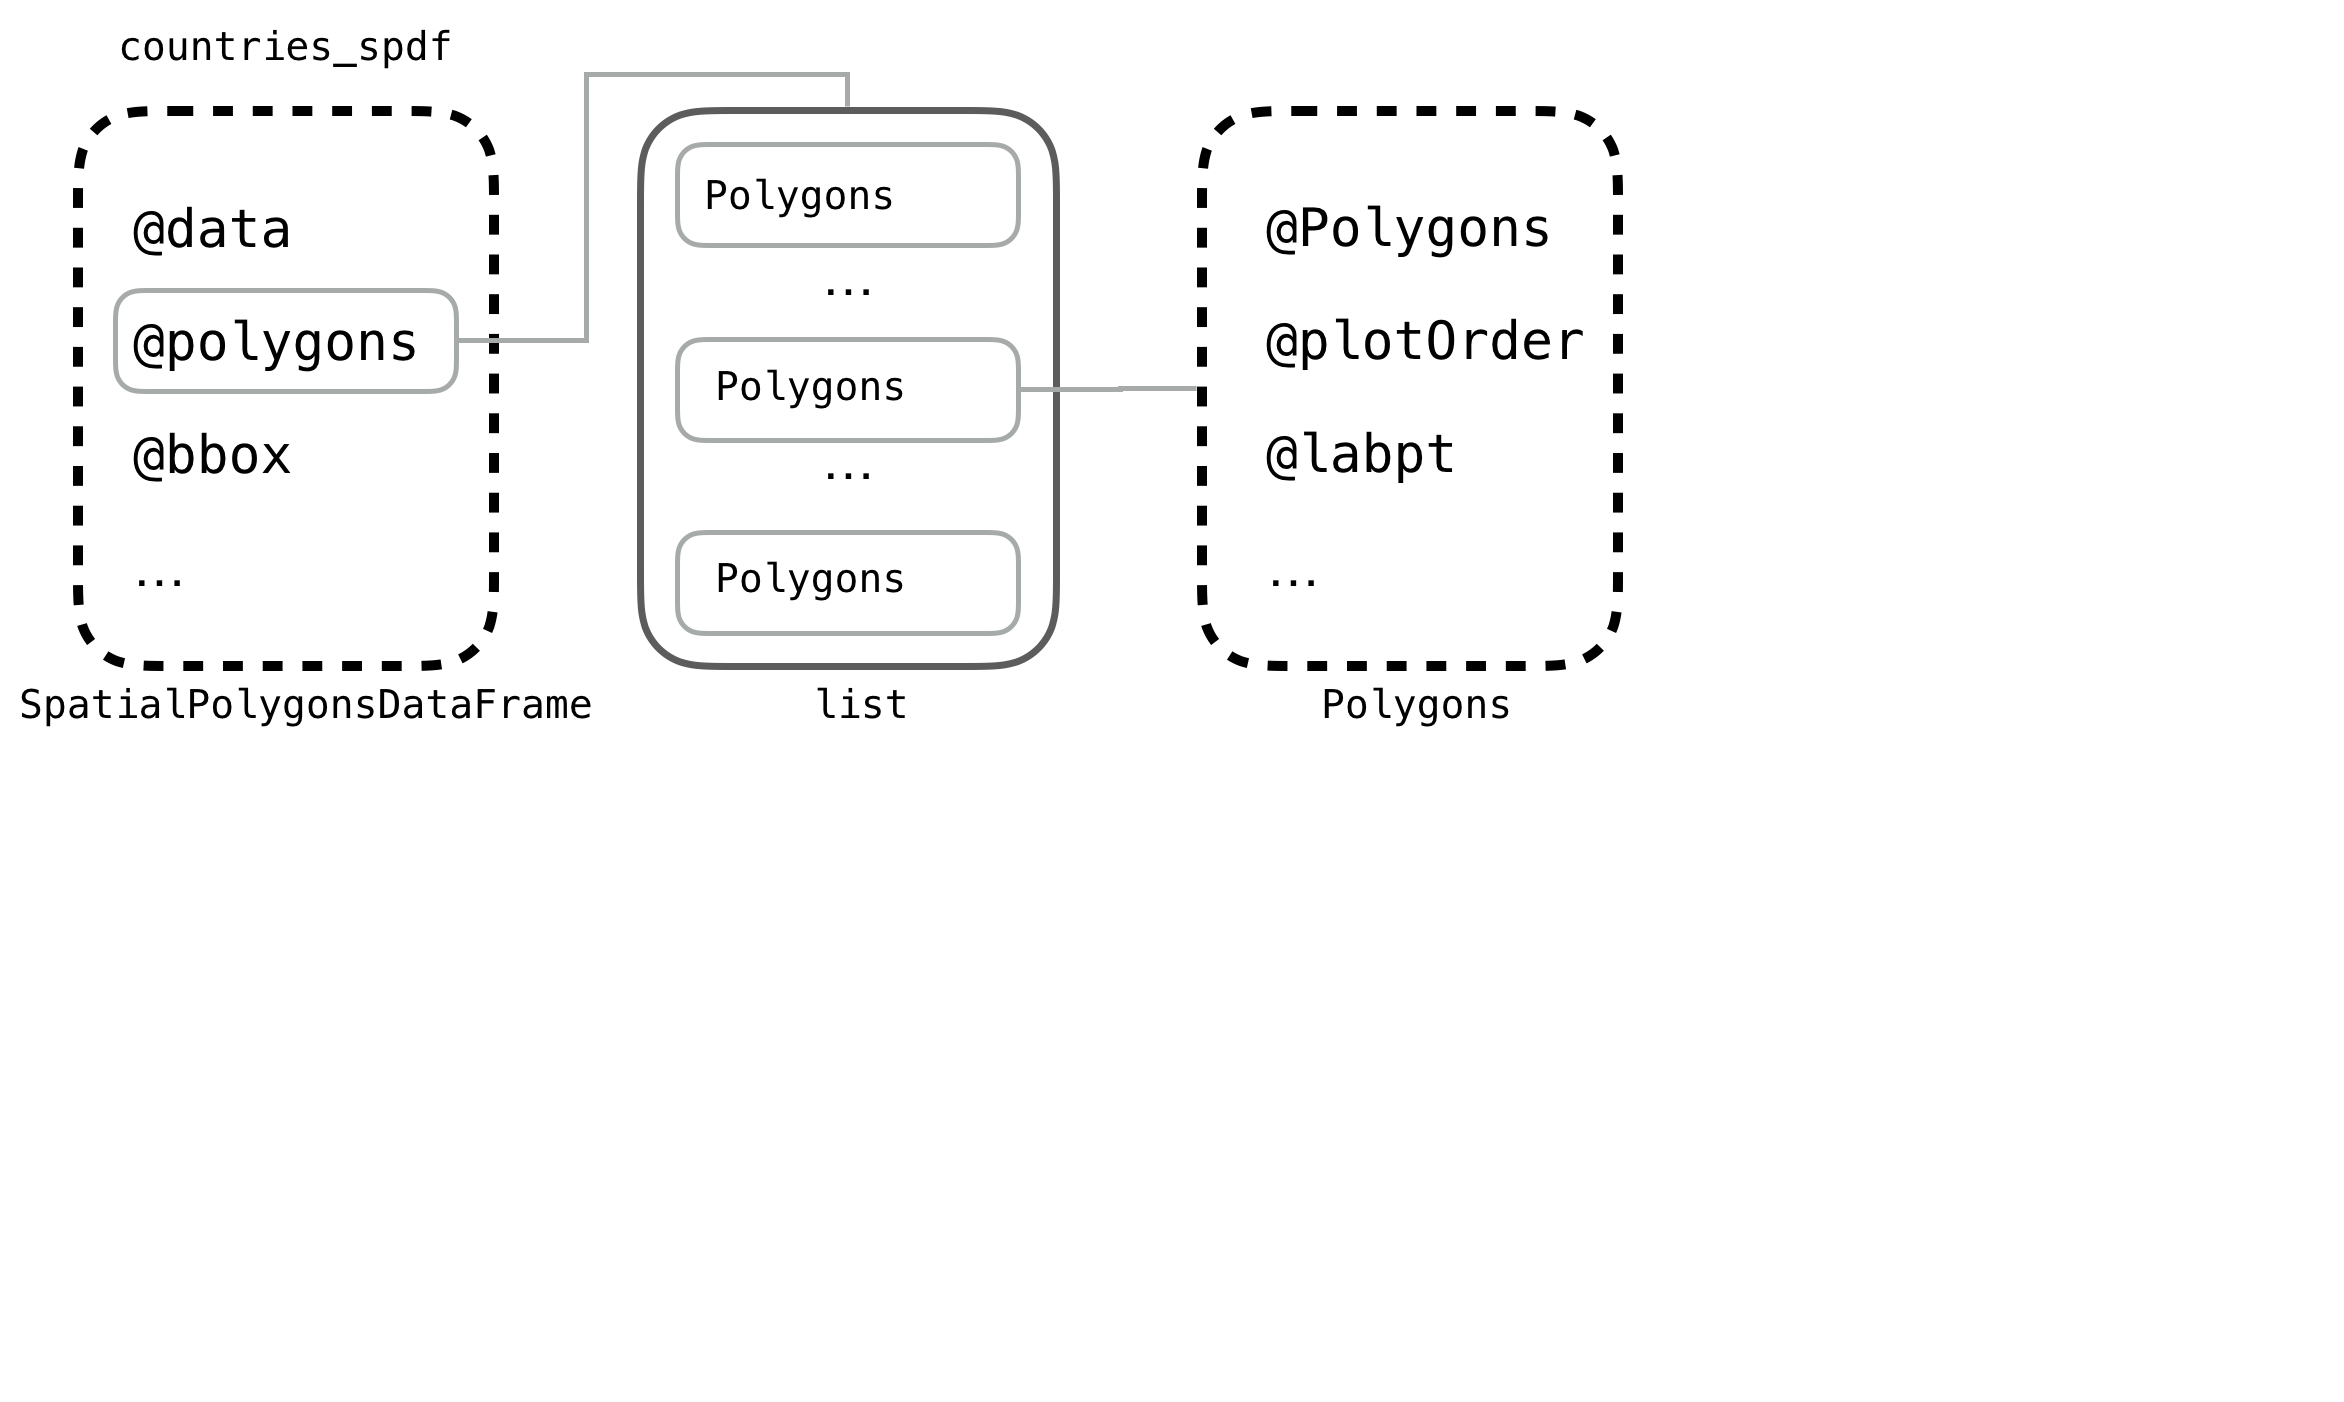
Hierarchy of SpatialPolygonsDataFrame
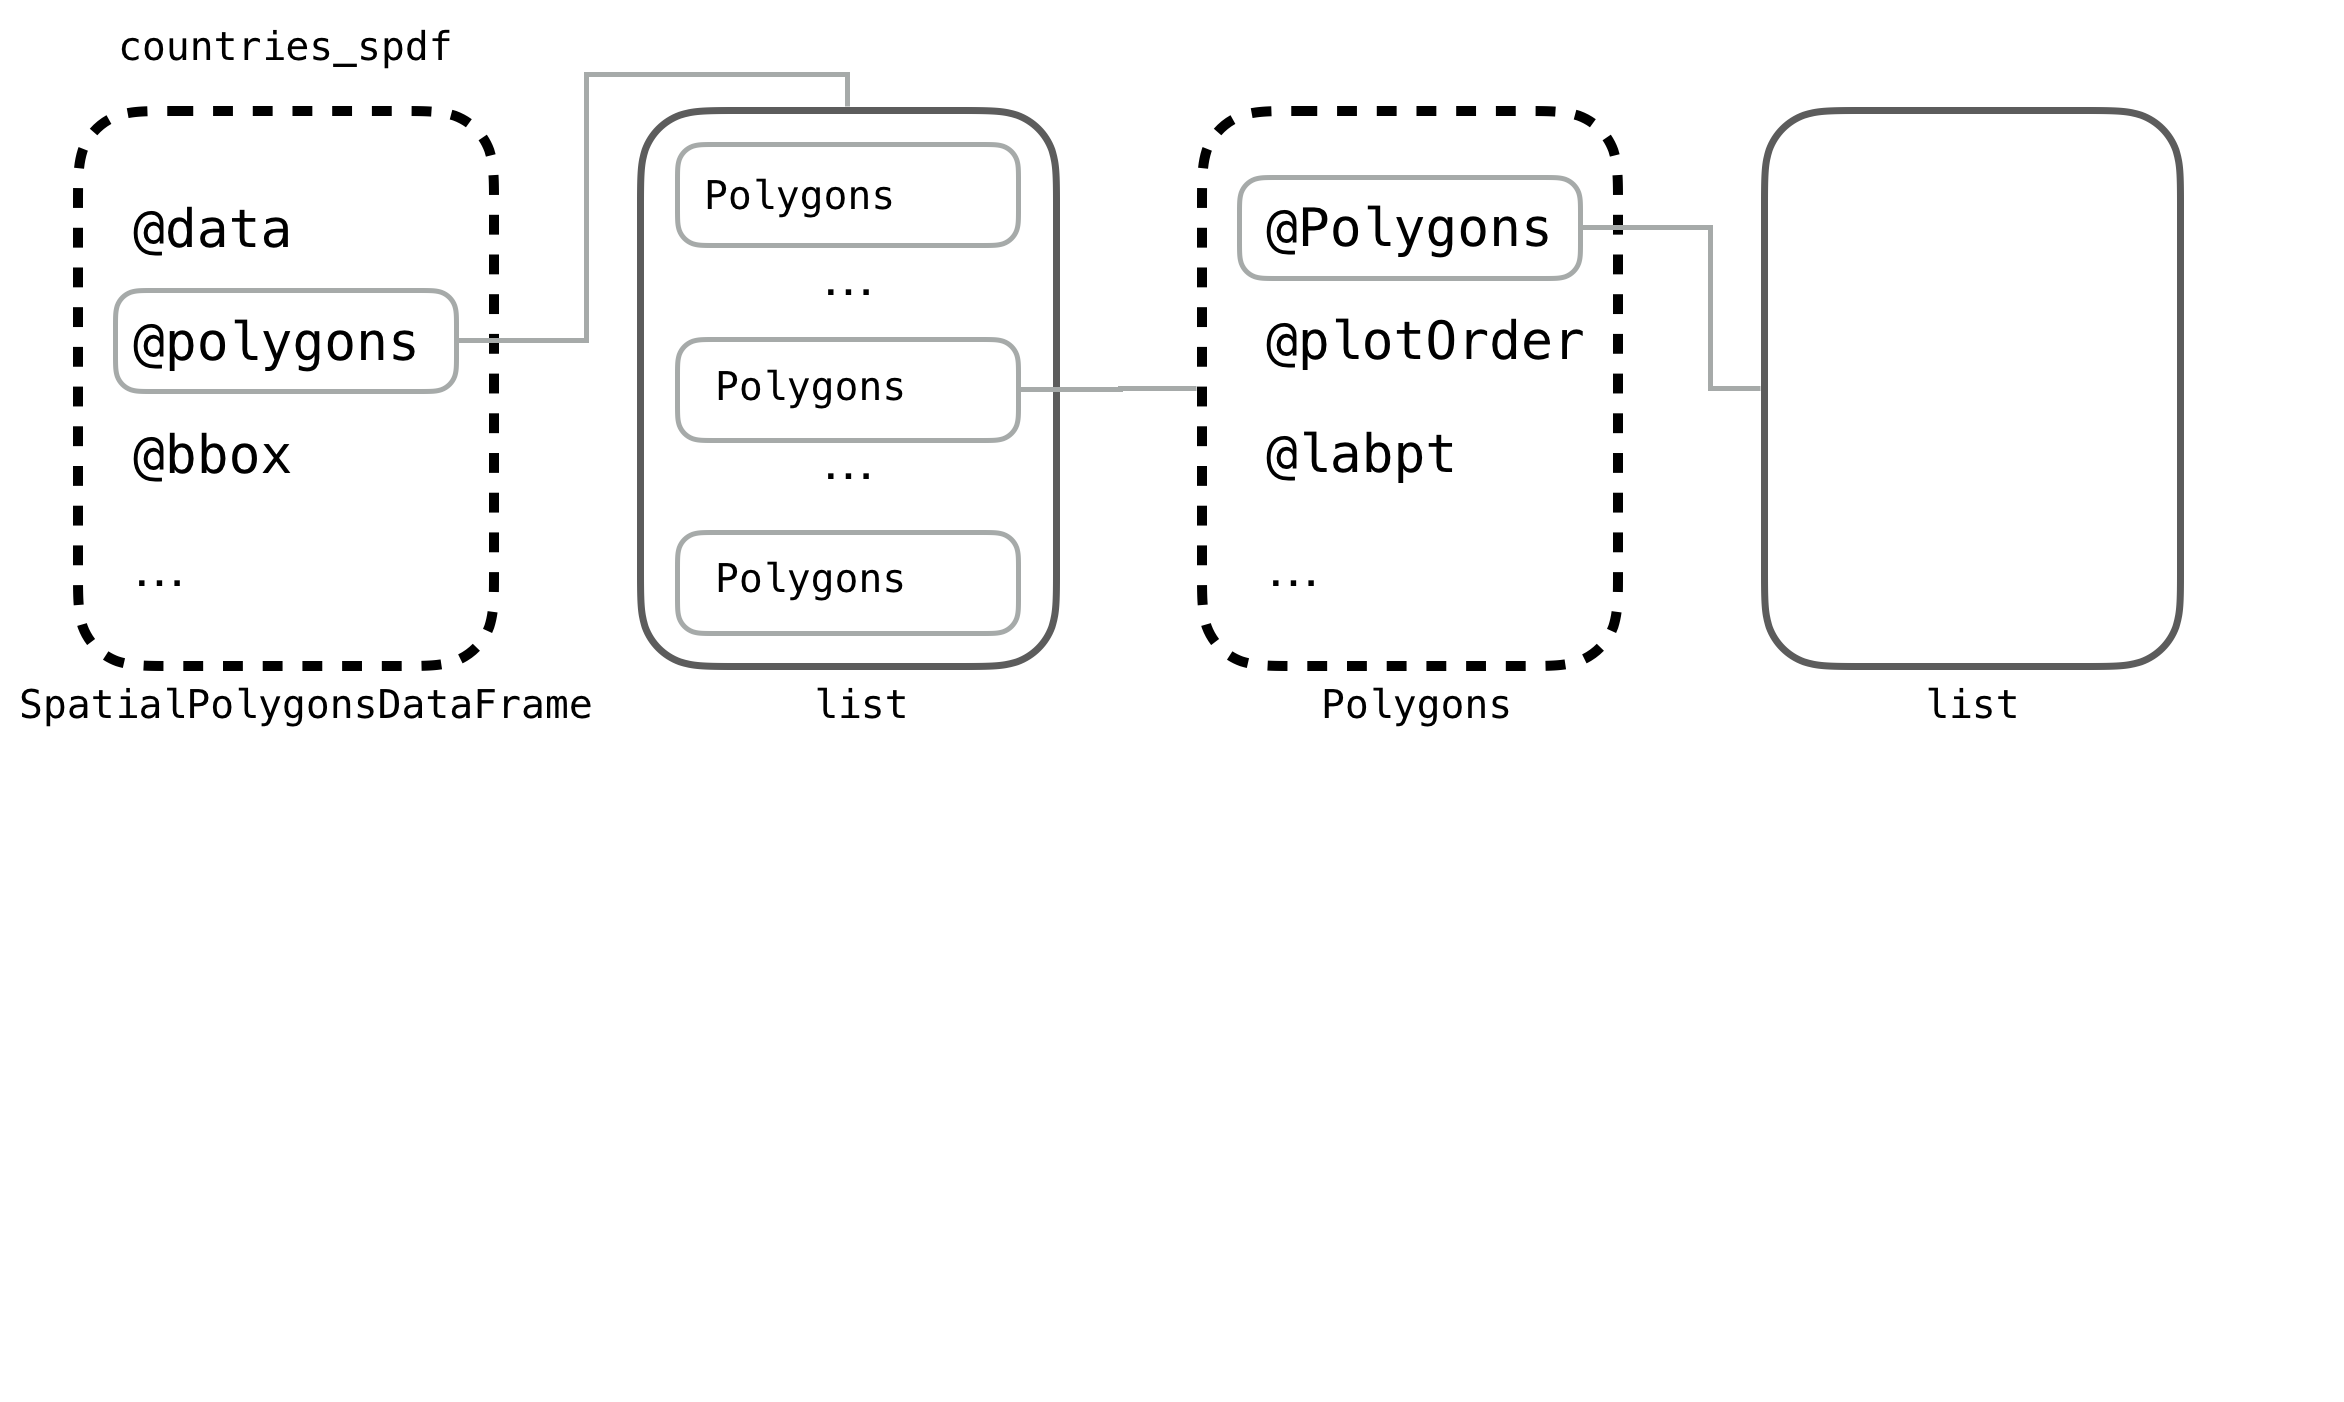
Hierarchy of SpatialPolygonsDataFrame
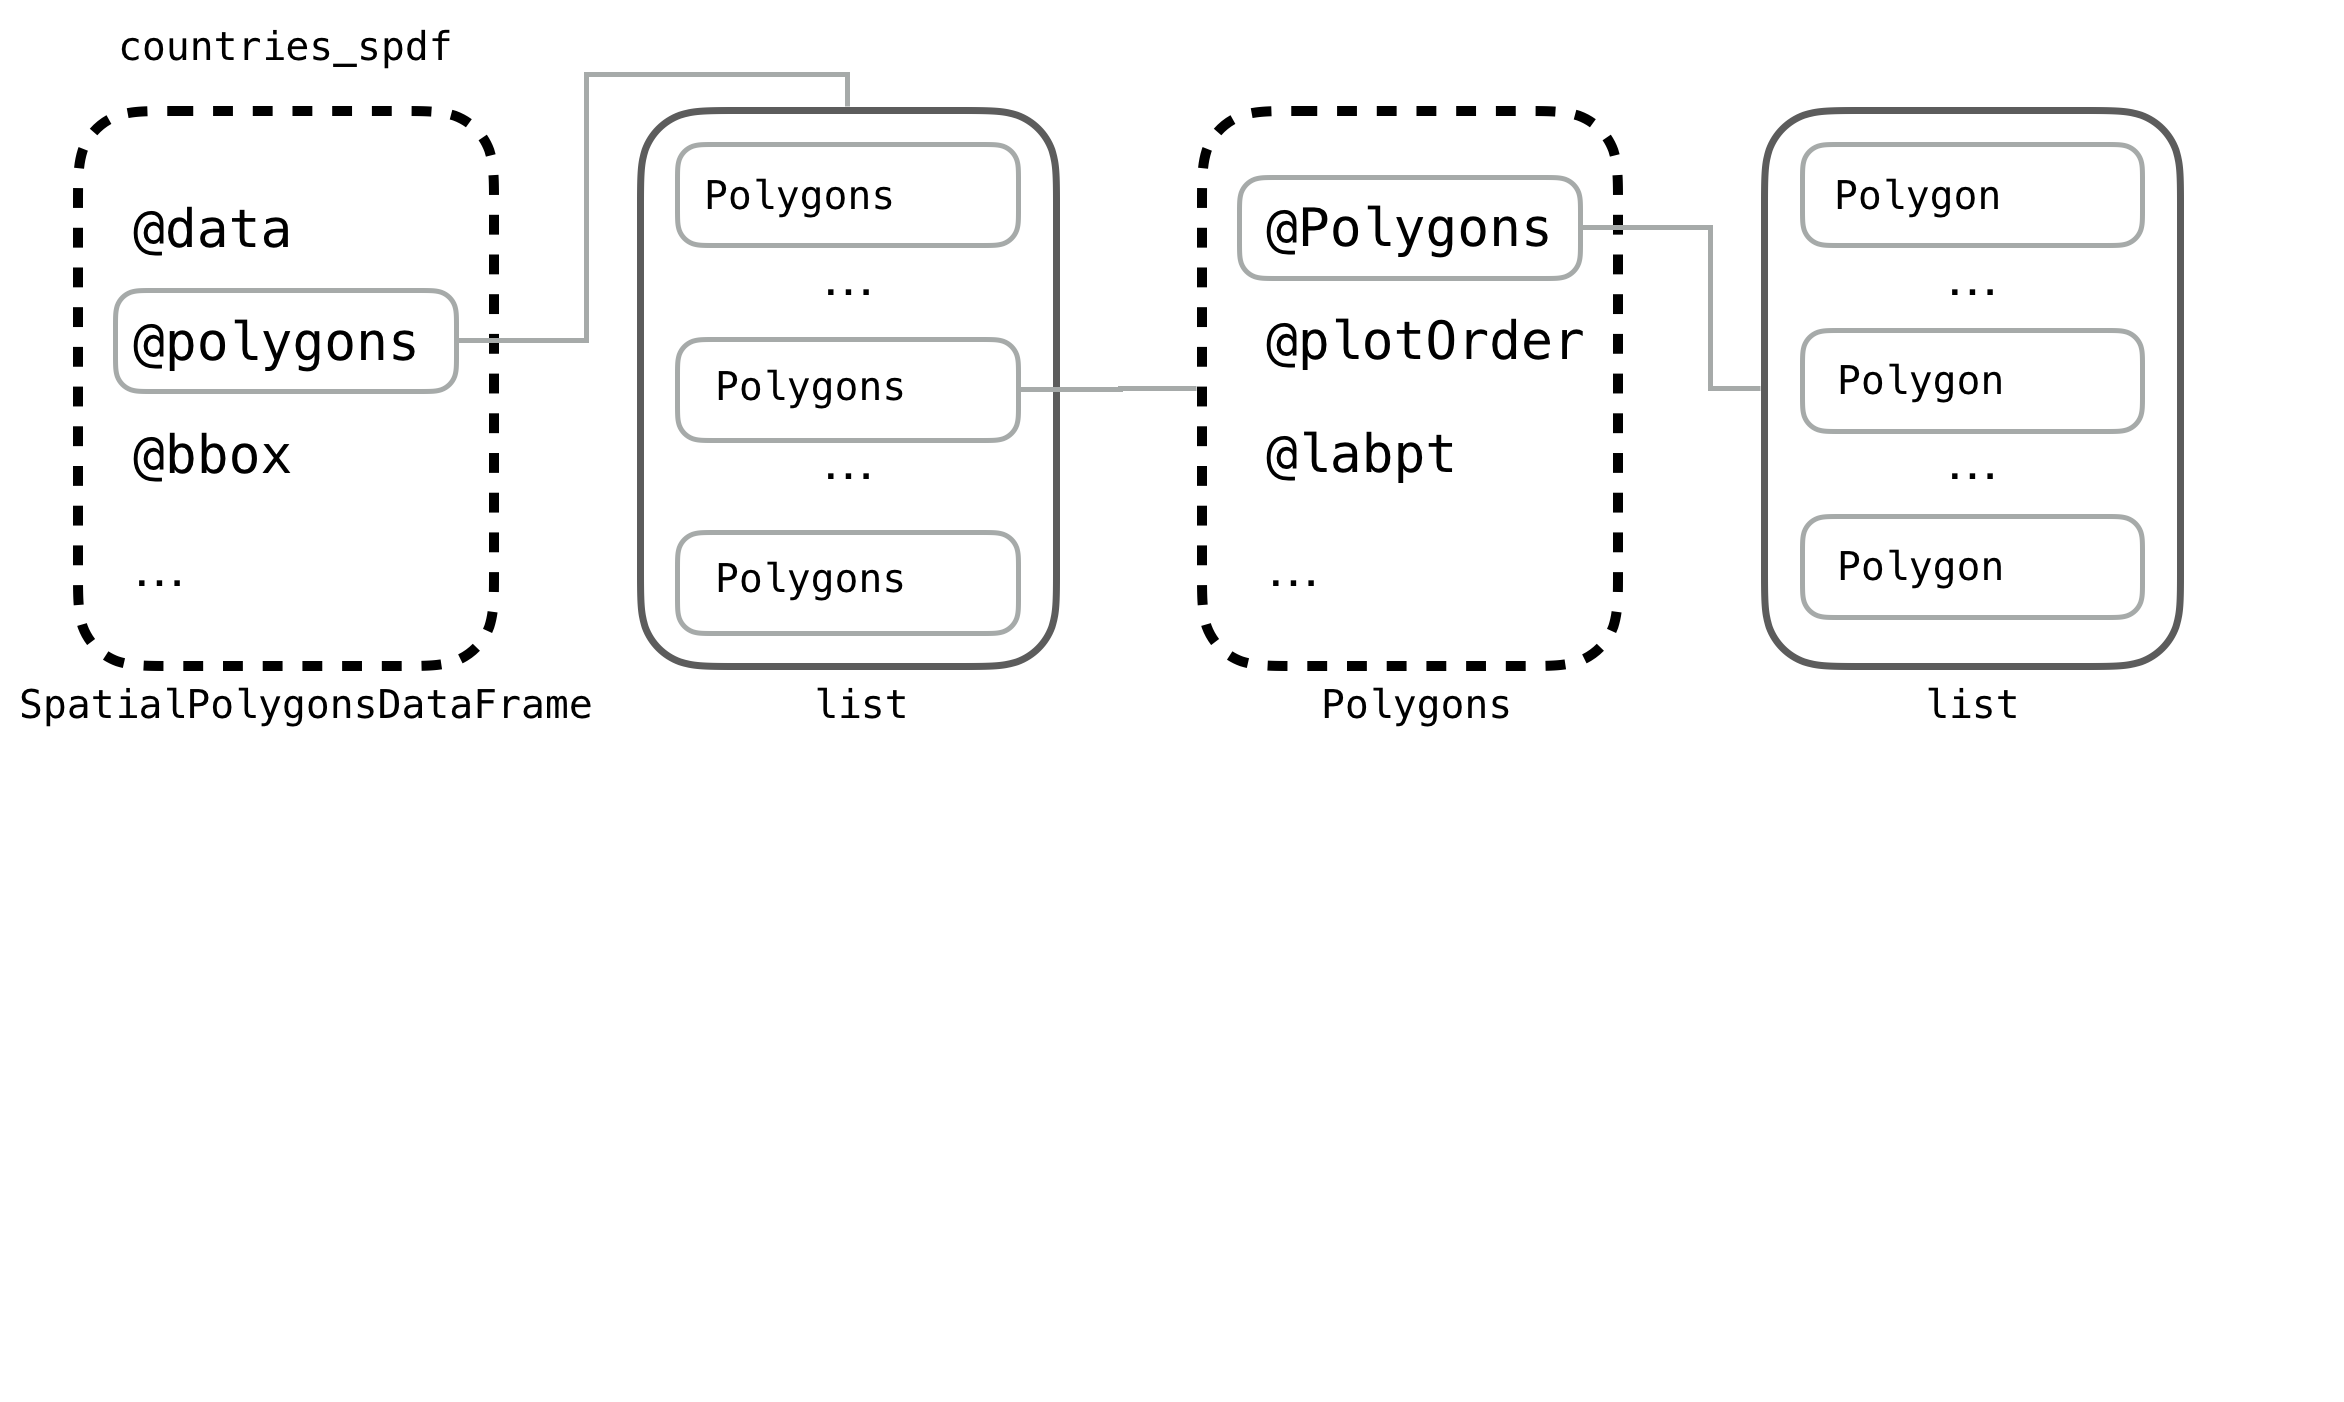
Hierarchy of SpatialPolygonsDataFrame
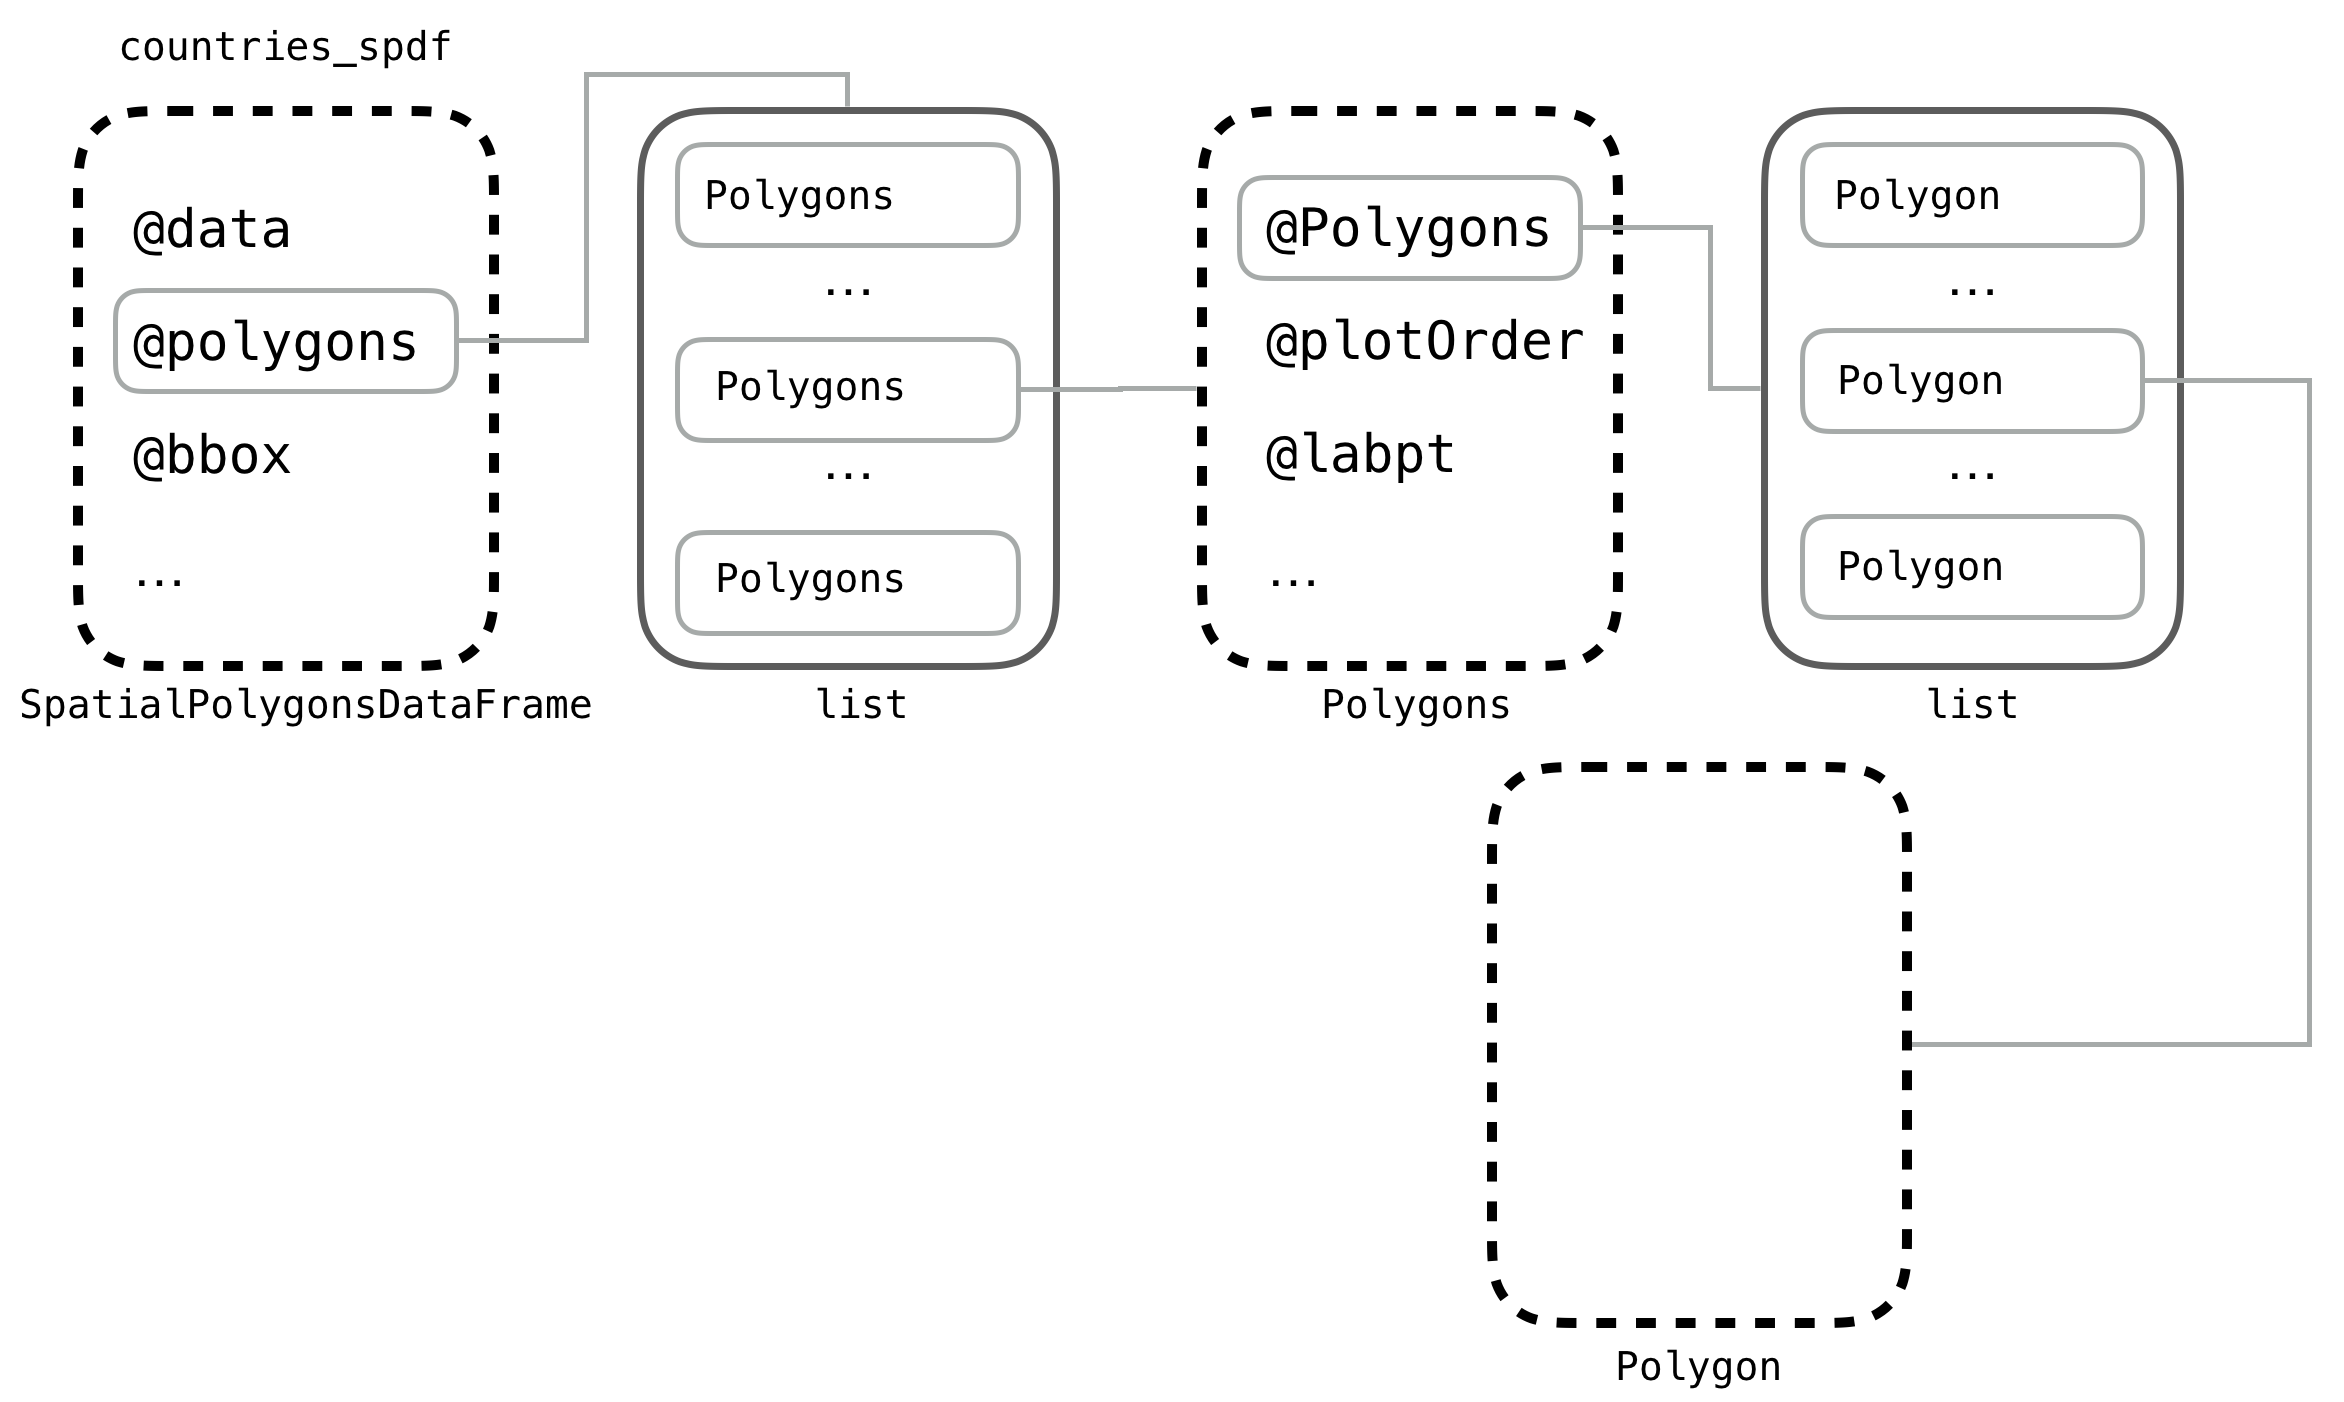
Hierarchy of SpatialPolygonsDataFrame
Other sp classes
Other sp classes
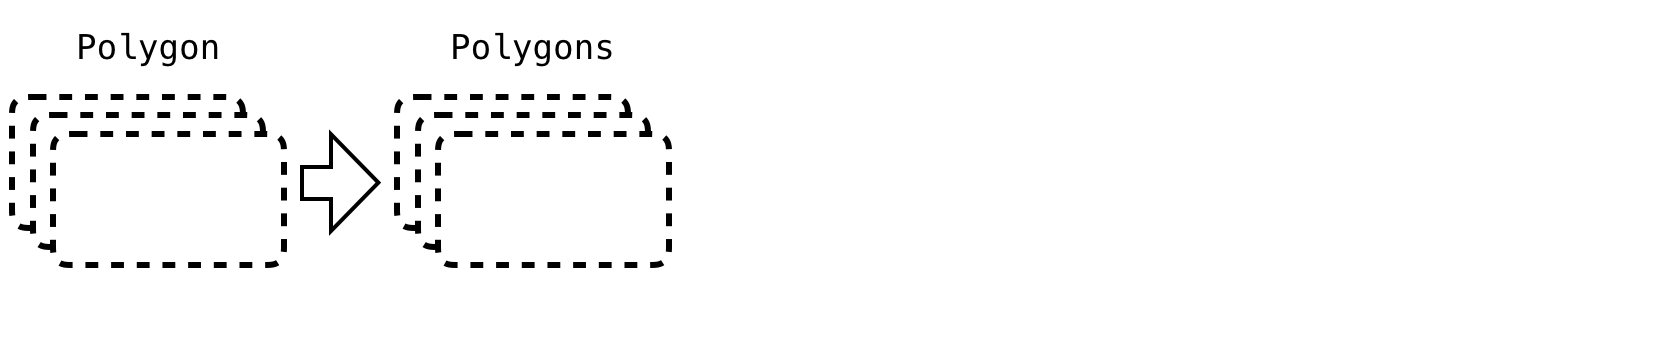
Other sp classes
Other sp classes
Other sp classes

Other sp classes

Other sp classes

Other sp classes
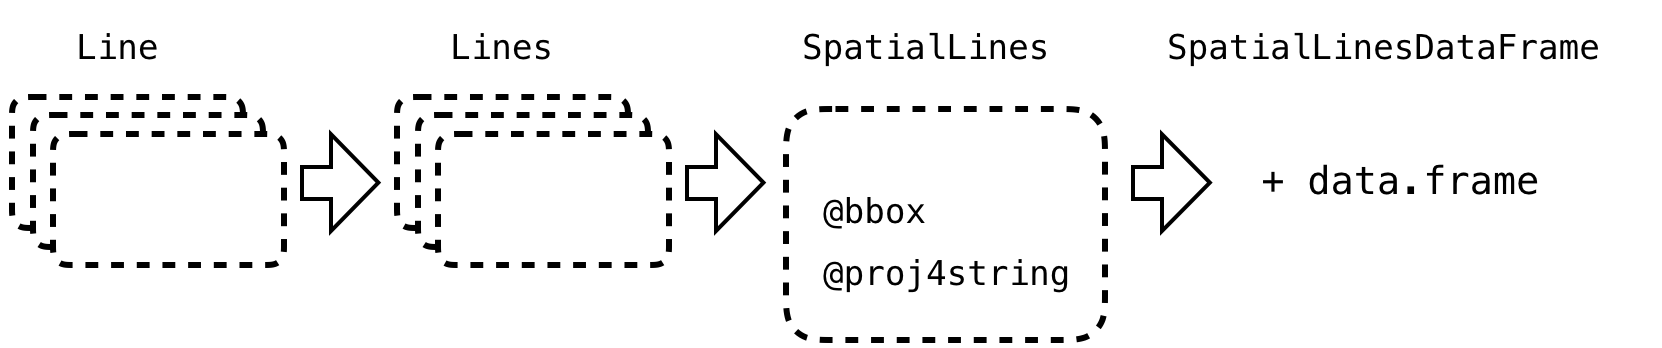
Other sp classes