Introduction to tmap
Visualizing Geospatial Data in R

Charlotte Wickham
Assistant Professor at Oregon State University
tmap displays spatial data
- Similar philosophy to
ggplot2:- A plot is built up in layers
ggplot2expects data in data frames,tmapexpects data in spatial objects- Layers consist of a type of graphical representation and mapping from visual properties to variables
Building a plot in layers
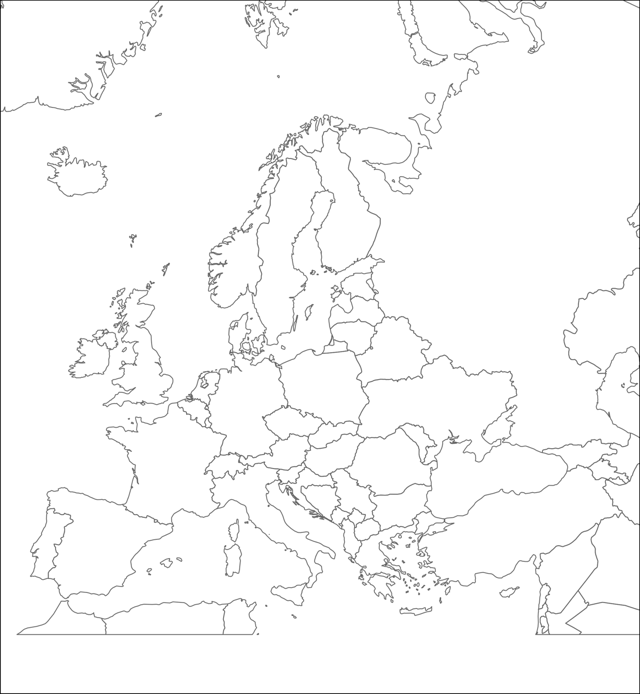
library(tmap) data(Europe)tm_shape(Europe) +tm_borders()

Building a plot in layers
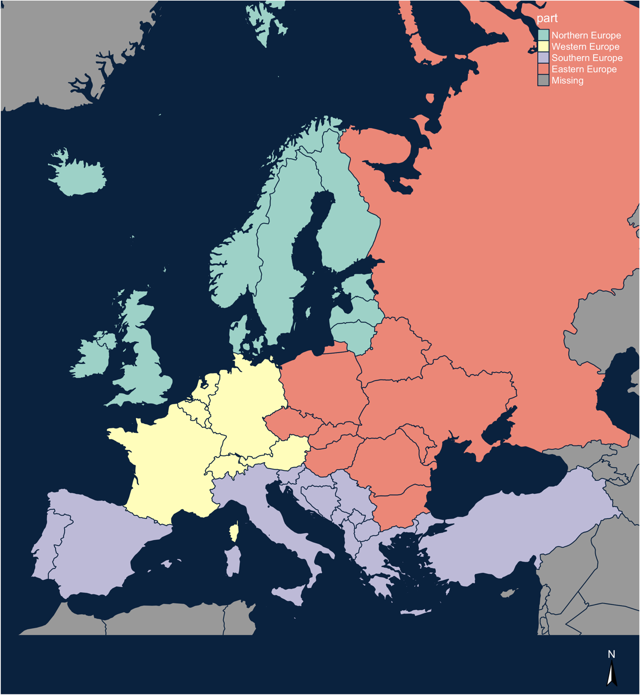
library(tmap) data(Europe)tm_shape(Europe) +tm_borders() + tm_fill(col = "part")
tm_fill()tm_borders()tm_polygons()tm_bubbles()tm_dots()tm_lines()tm_raster()tm_text()
Building a plot in layers
library(tmap) data(Europe)tm_shape(Europe) +tm_borders() + tm_fill(col = "part") + tm_compass() + tmap_style("cobalt")

Key differences to ggplot2
- No
scale_equivalents, tweaks to scales happen in relevant layer call tm_shape()defines default data for any subsequent layers, you can have many in a single plot- No need for
xandyaesthetics, these are inherent in spatial objects - No special evaluation, when mapping variables they must be quoted
Let's practice!
Visualizing Geospatial Data in R

