Polishing a map
Visualizing Geospatial Data in R

Charlotte Wickham
Assistant Professor at Oregon State University
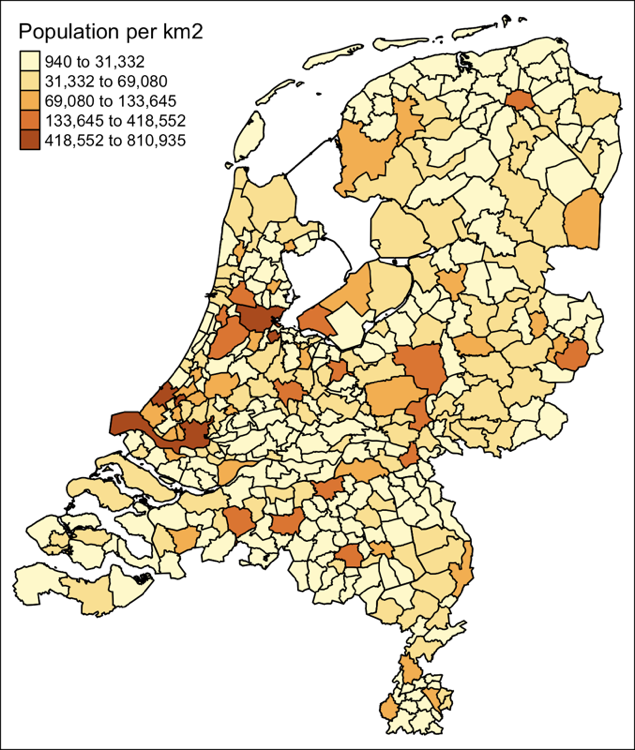
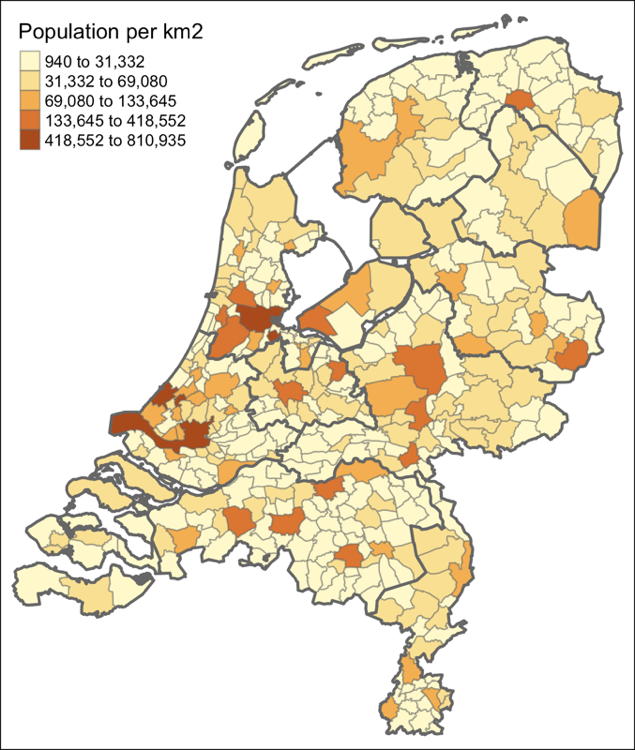
Critiquing our map
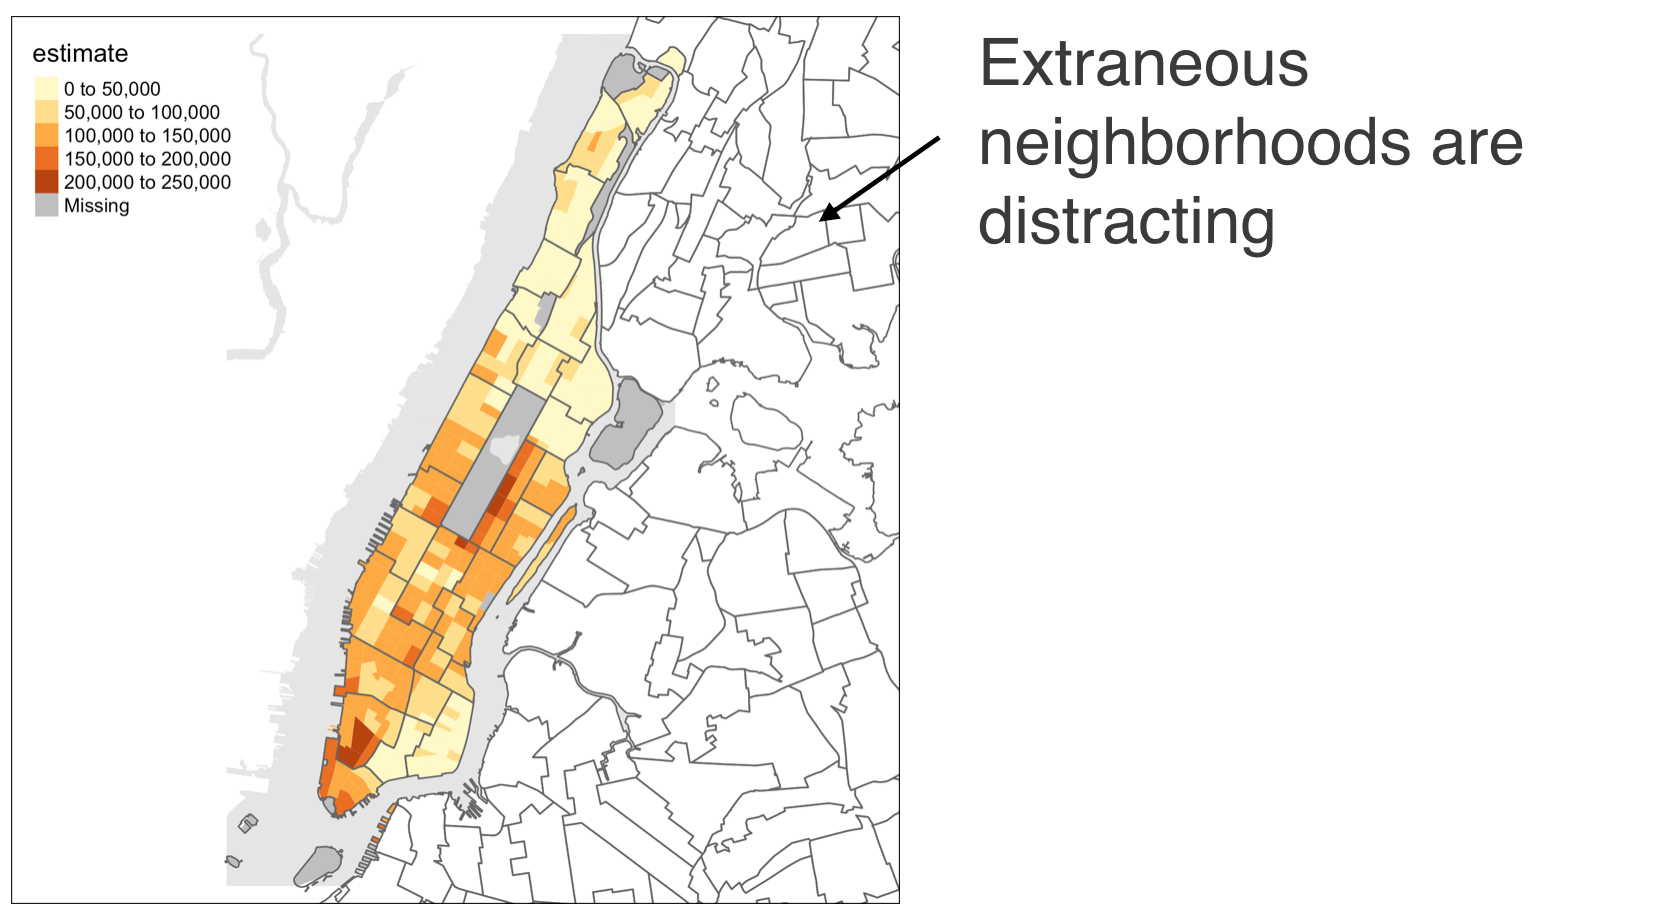
Critiquing our map
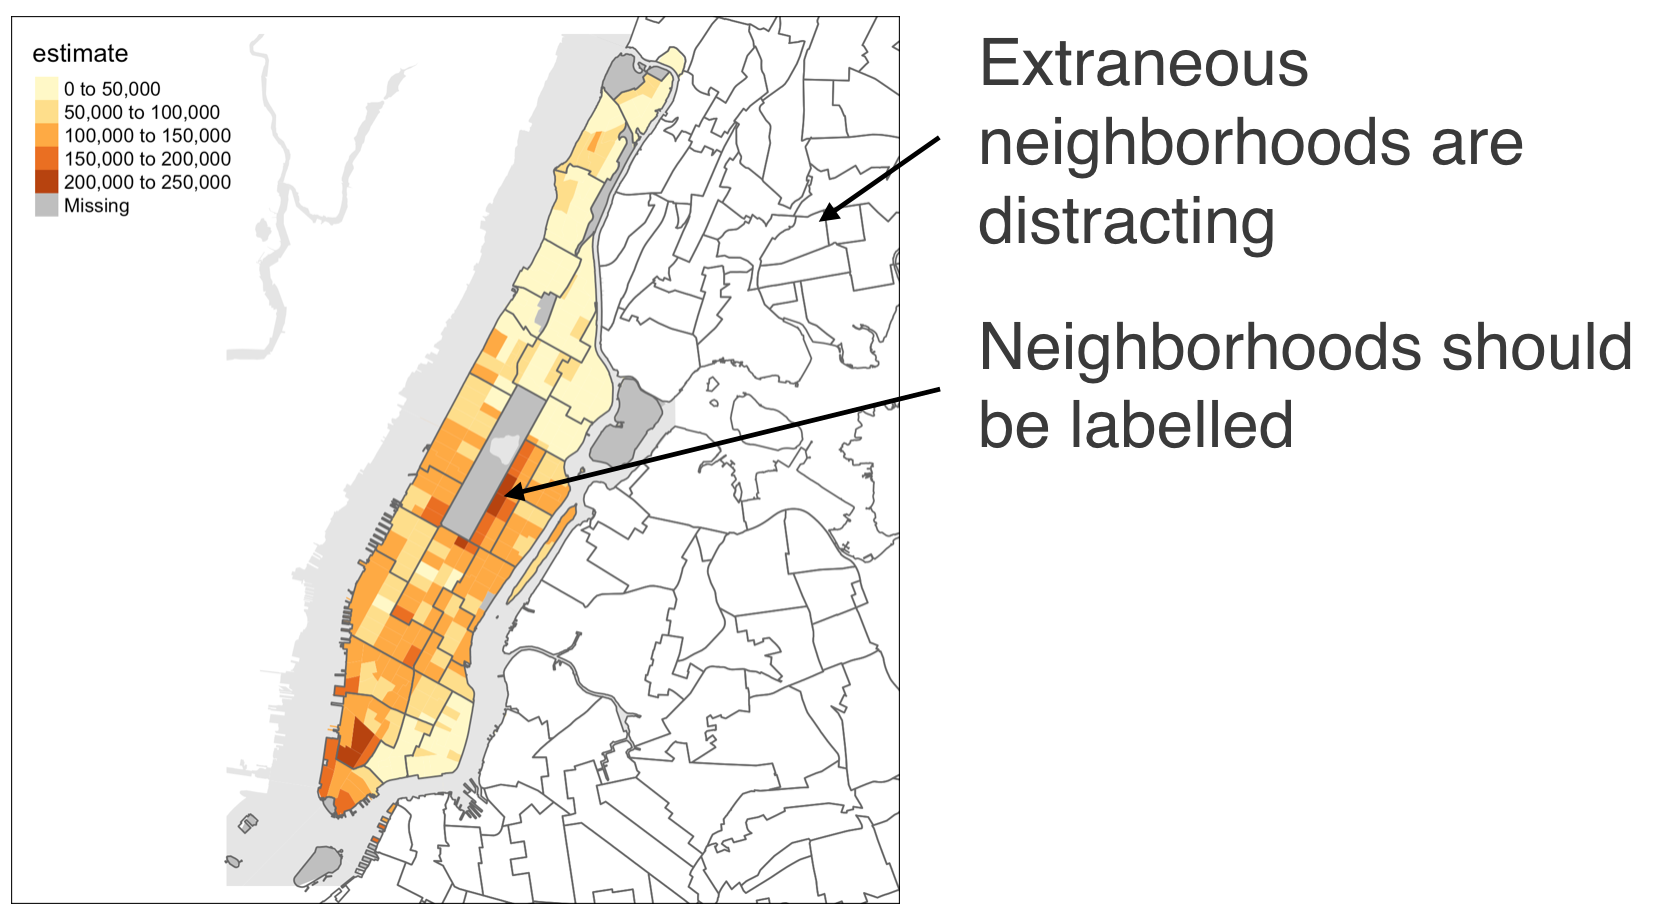
Critiquing our map
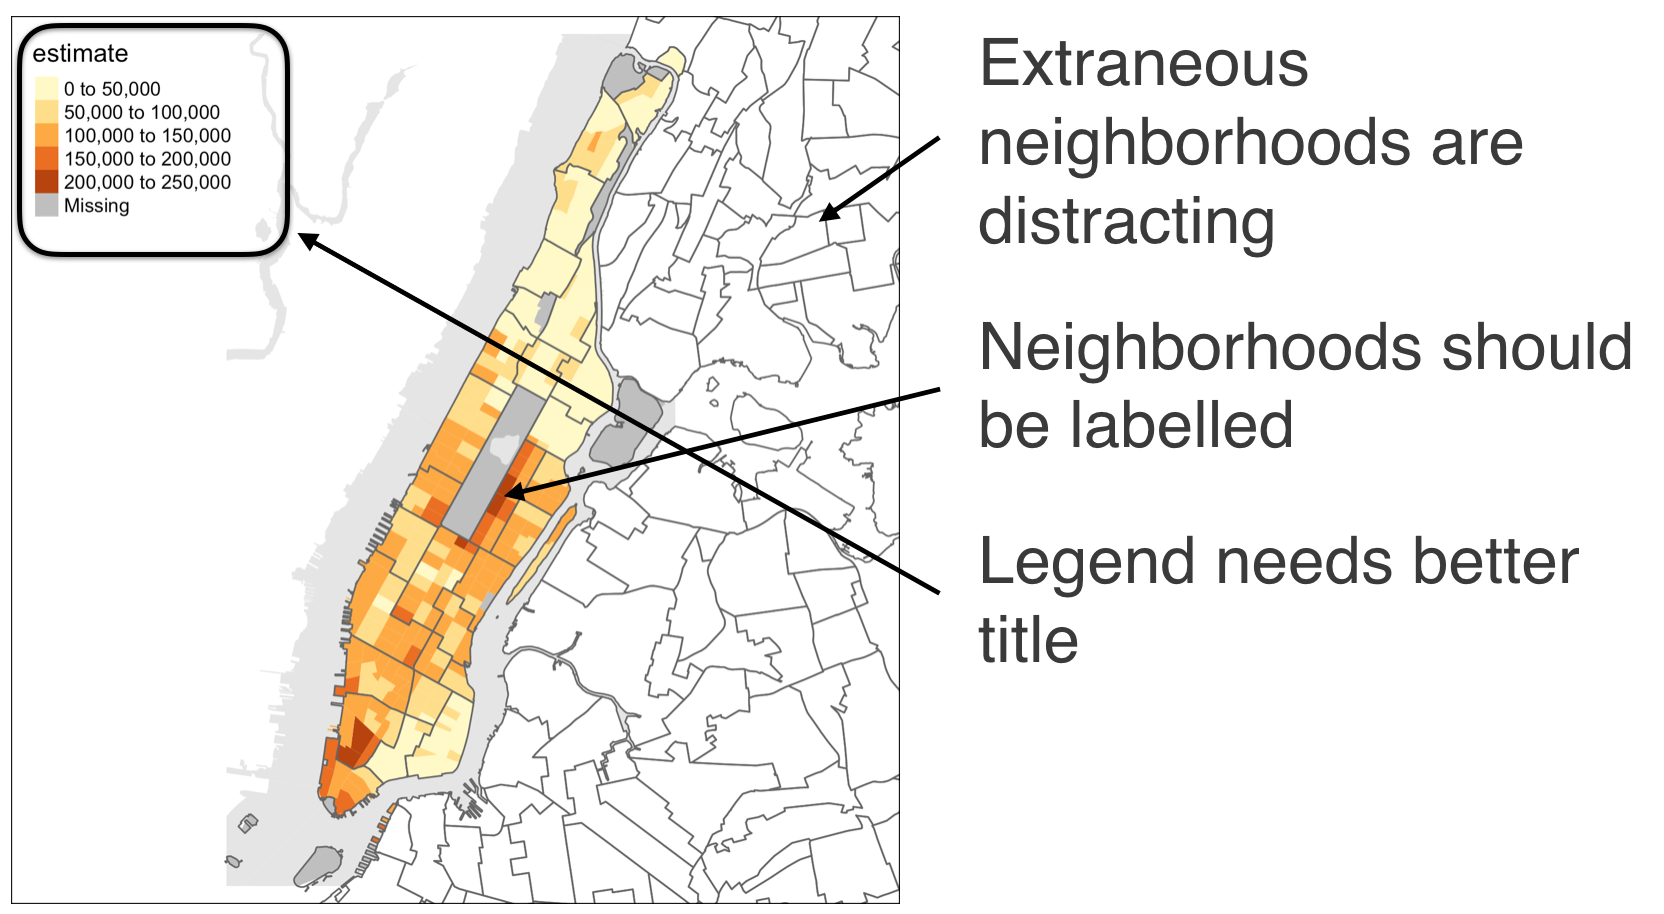
Critiquing our map
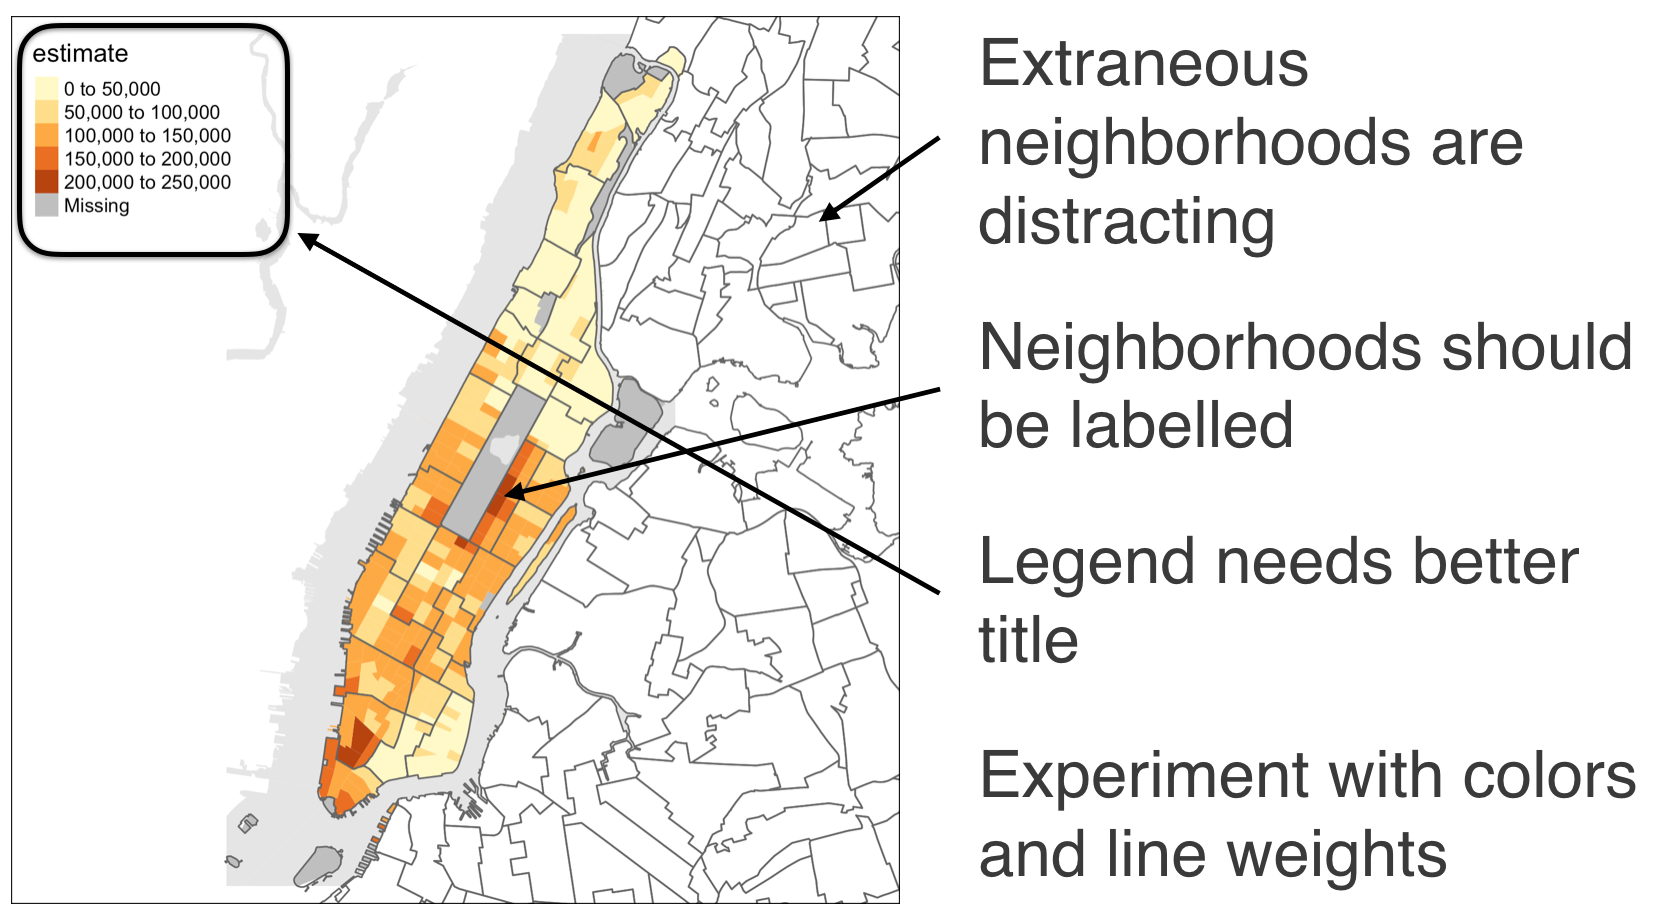
The effect of line weights and color
Visualizing Geospatial Data in R
Charlotte Wickham
Assistant Professor at Oregon State University

