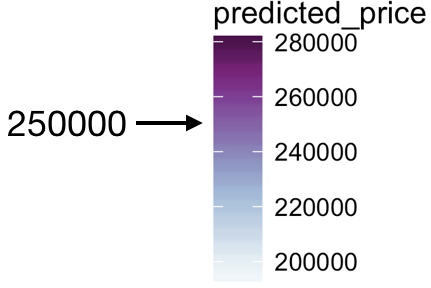
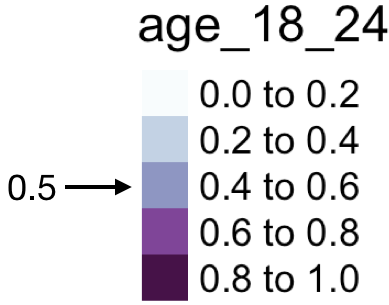
More about color scales
Visualizing Geospatial Data in R

Charlotte Wickham
Assistant Professor at Oregon State University
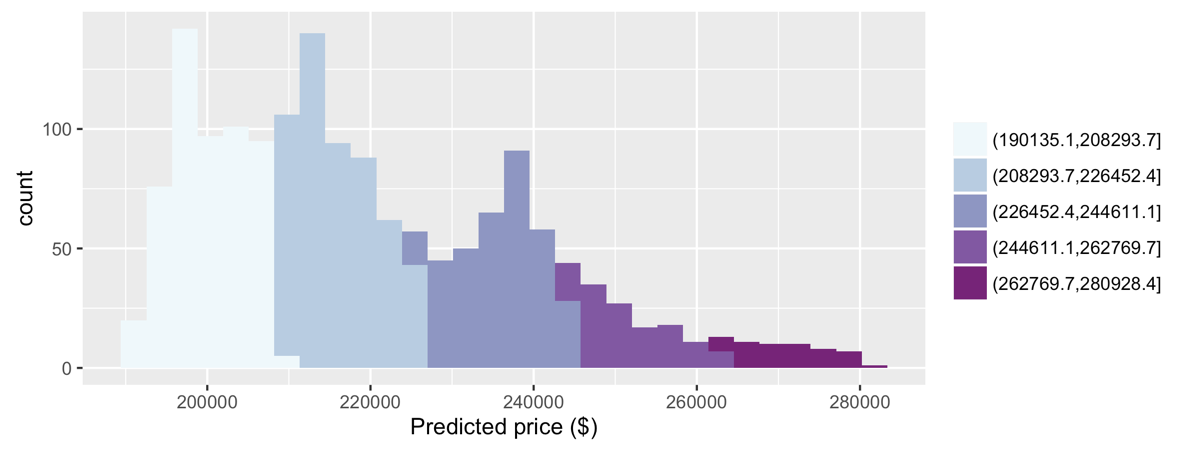
Cutting a variable into bins (equal)
library(classInt)classIntervals(values, n = 5, style = "equal")
style: equal
[190135.1,208293.7) [208293.7,226452.4) [226452.4,244611.1) [244611.1,262769.7) [262769.7,280928.4]
                537                 528                 351                 131                  53
Cutting a variable into bins
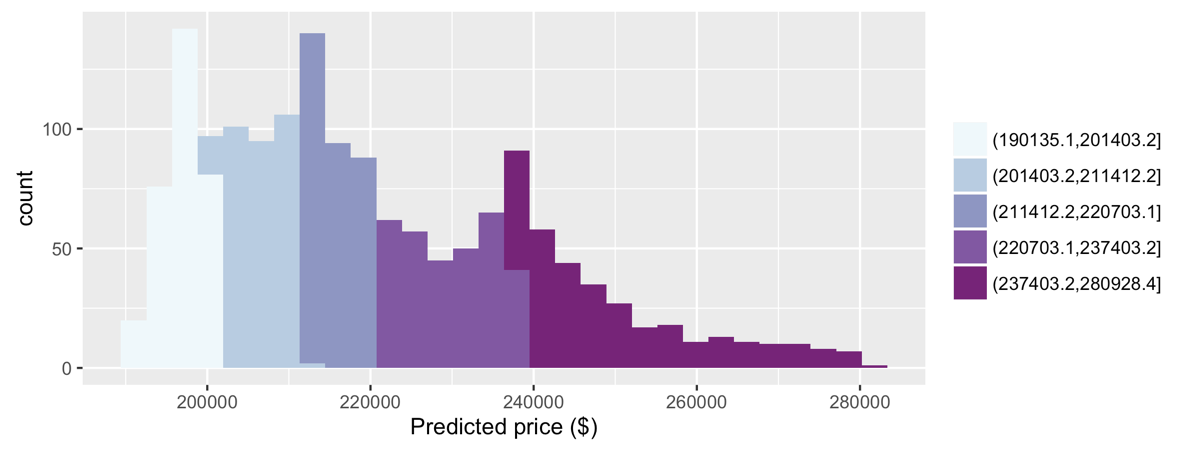
classIntervals(values, n = 5, style = "quantile")
style: quantile
[190135.1,201403.2) [201403.2,211412.2) [211412.2,220703.1) [220703.1,237403.2) [237403.2,280928.4]
                320                 320                 320                 320                 320
Cutting a variable into bins
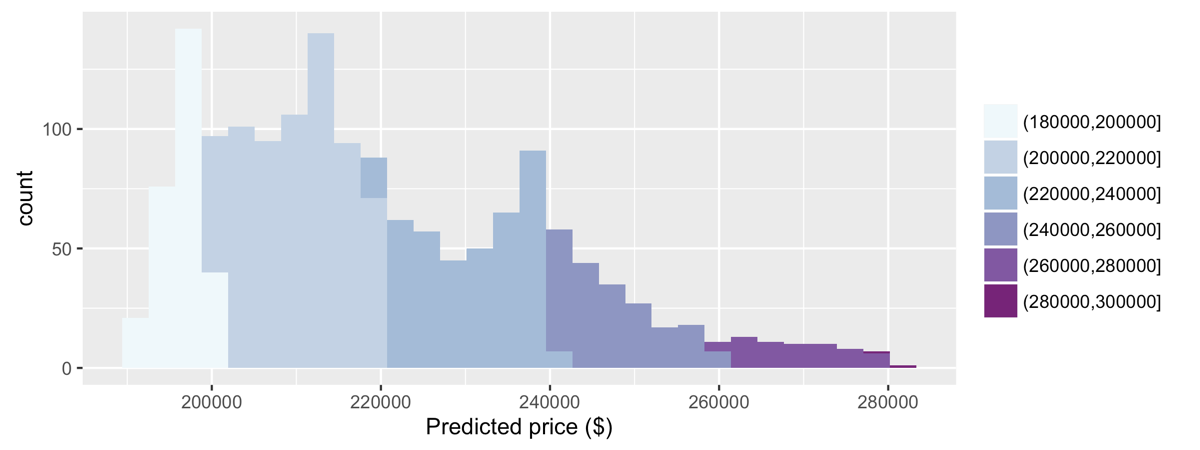
classIntervals(values, n = 5, style = "pretty")
style: pretty
[180000,2e+05)  [2e+05,220000) [220000,240000) [240000,260000) [260000,280000)  [280000,3e+05]
           279             664             394             199              62               2
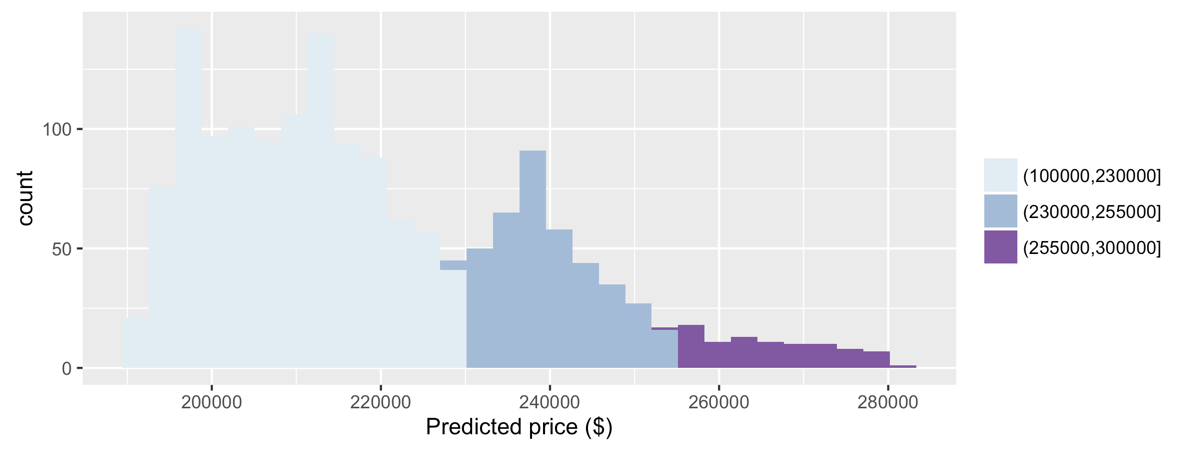
Cutting a variable into bins
classIntervals(values, style = "fixed",
               fixedBreaks = c(100000, 230000, 255000, 300000))
style: fixed
 [1e+05,230000) [230000,255000)  [255000,3e+05]
           1120             390              90