Color scales
Visualizing Geospatial Data in R

Charlotte Wickham
Assistant Professor at Oregon State University
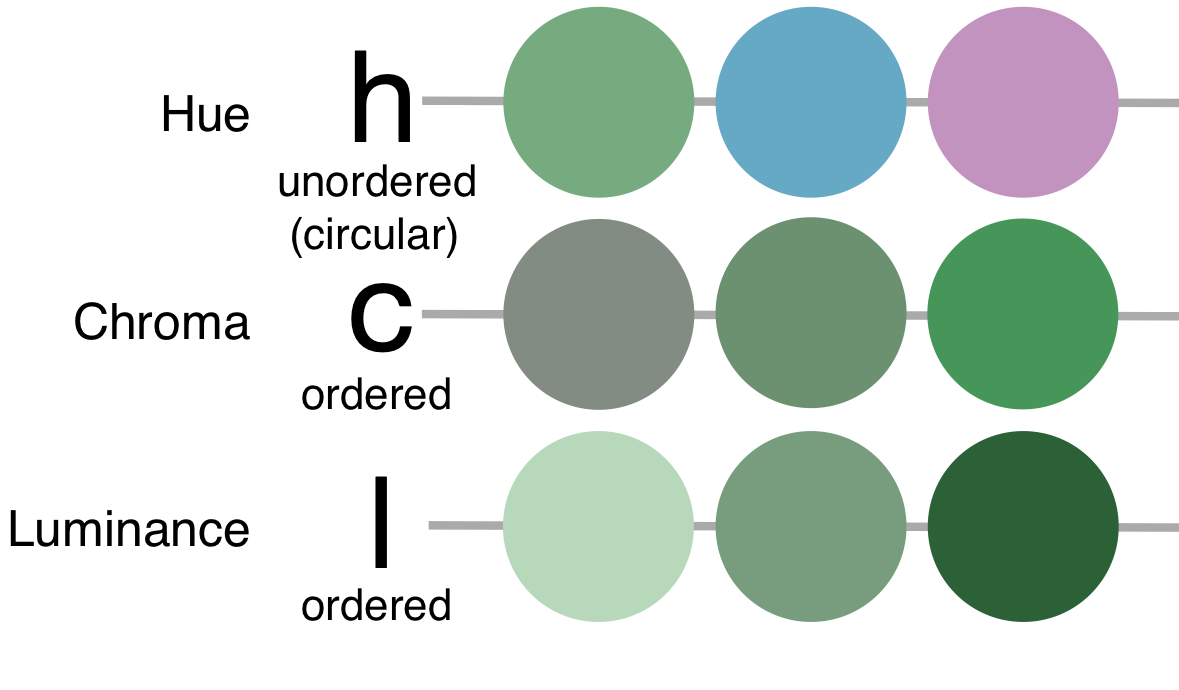
A perceptual color space: HCL
- Trichromatic - we perceive color as three-dimensional
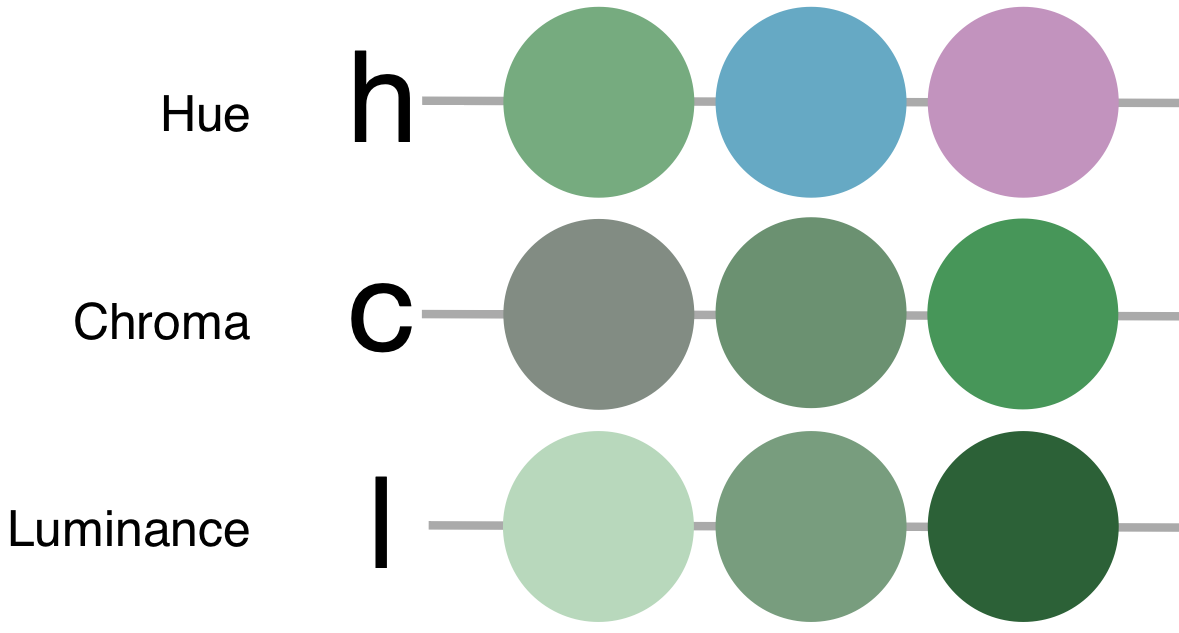
1 Image credit: Hadley Wickham
A perceptual color space: HCL
- Trichromatic - we perceive color as three-dimensional

1 Image credit: Hadley Wickham
A perceptual color space: HCL
- Trichromatic - we perceive color as three-dimensional
1 Image credit: Hadley Wickham
A perceptual color space: HCL
- Trichromatic - we perceive color as three-dimensional

1 Image credit: Hadley Wickham
A perceptual color space: HCL
- Trichromatic - we perceive color as three-dimensional

1 Image credit: Hadley Wickham
Types of scale