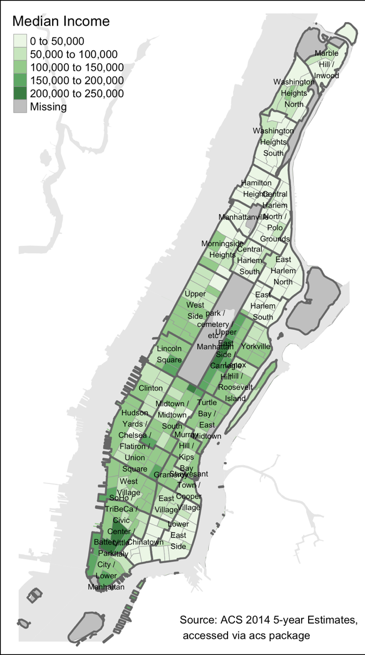
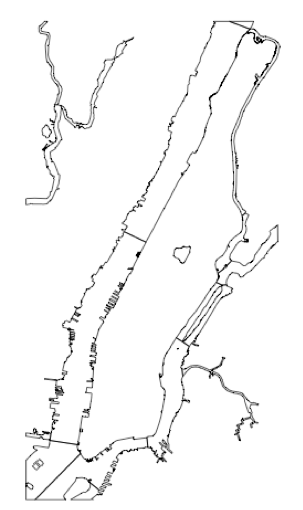
Reading in spatial data

Visualizing Geospatial Data in R

Charlotte Wickham

Assistant Professor at Oregon State University

Median incomes in New York County

  • Census tracts are areas with roughly the same number of people
  • Spatial objects:
    • Census tract polygons
    • Larger neighborhood polygons
    • Areas of water polygons

nyc_map.png

Visualizing Geospatial Data in R

Procedure

  • Read in shape files that describe neighborhoods and waterways
  • Match up two different coordinate systems
  • Merge data from a data frame into a SpatialPolygonsDataFrame
  • Polish a map to be publication ready

nyc_map.png

Visualizing Geospatial Data in R

Reading in a shape file

  • Vector data: data described by points, lines, polygons
  • Shape file is the most common format
Visualizing Geospatial Data in R

Reading in a shape file

# rgdal::readOGR() reads in vector formats
library(rgdal) 
library(sp)

dir()
"water"
dir("water")
"water-areas.dbf" "water-areas.prj" 
"water-areas.shp" "water-areas.shx"
water <- readOGR("water", "water-areas")
OGR data source with driver: ESRI Shapefile 
Source: "water", layer: "water-areas"
with 20 features
It has 5 fields
Visualizing Geospatial Data in R

Checking the result

summary(water)
Object of class SpatialPolygonsDataFrame
Coordinates:
        min       max
x -74.04731 -73.90866
y  40.68419  40.88207
Is projected: FALSE 
...
plot(water)

nyc_lines.png

Visualizing Geospatial Data in R

Reading in a raster file

library(rgdal)  # rgdal::readGDAL() reads in raster formats to sp objects
library(raster) # raster::raster() reads in raster formats to raster objects
dir()
"usgrid_data_2000"   "usgrid_data_2000_1"
dir("usgrid_data_2000")
"metadata"     "usarea00.tif"  "usba00.tif" "usfb00.tif" "usgrid-2000-variables.xls" "usp2500.tif" 
"uspop300.tif" "uspov00.tif"  "uspvp00.tif"
total_pop <- raster("usgrid_data_2000/uspop300.tif")
Visualizing Geospatial Data in R

Checking the result

total_pop
class       : RasterLayer 
dimensions  : 3120, 7080, 22089600  (nrow, ncol, ncell)
resolution  : 0.008333333, 0.008333333  (x, y)
extent      : -125, -66, 24, 50  (xmin, xmax, ymin, ymax)
coord. ref. : +proj=longlat +datum=NAD83 +no_defs +ellps=GRS80 +towgs84=0,0,0 
data source : /Users/wickhamc/Documents/Projects/courses-visualizing-geospatial-
              data-in-r/data/census_grids/usgrid_data_2000/uspop300.tif 
names       : uspop300 
values      : 0, 65535  (min, max)
Visualizing Geospatial Data in R

Let's practice!

Visualizing Geospatial Data in R

Preparing Video For Download...