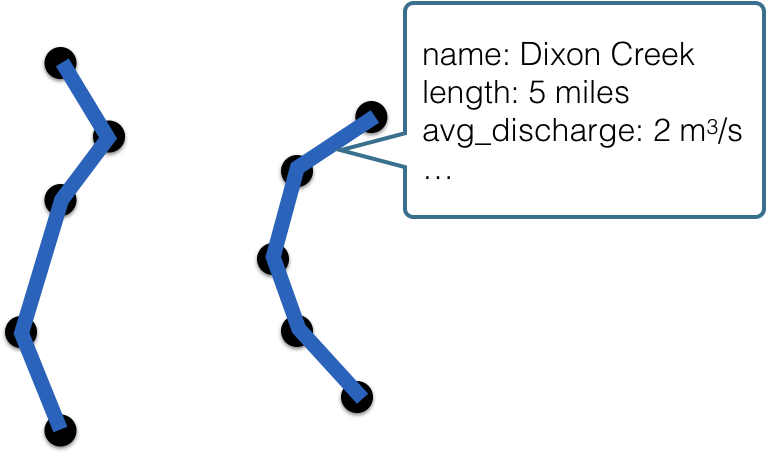
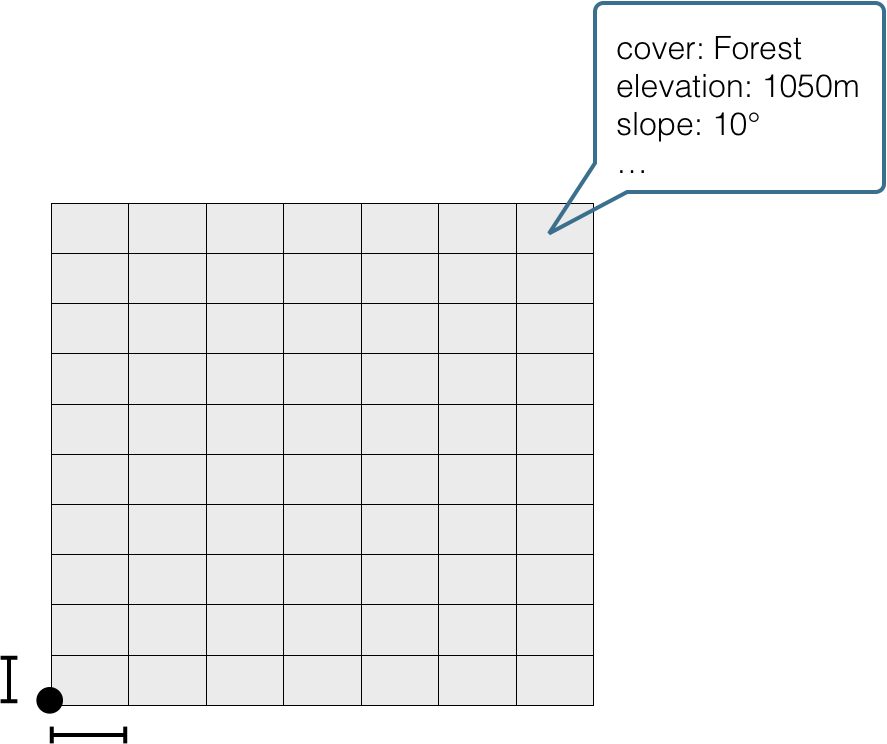
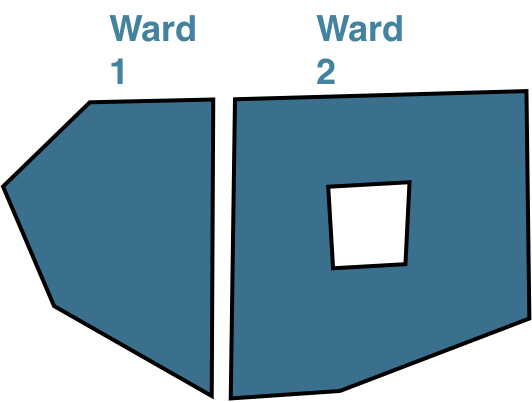
Common types of spatial data
Visualizing Geospatial Data in R

Charlotte Wickham
Assistant Professor at Oregon State University
Types of spatial data
- Point

Types of spatial data
- Point
- Line

Types of spatial data
- Point
- Line
- Polygon

Types of spatial data
- Point
- Line
- Polygon
- Raster (aka gridded)

House prices by ward
- Wards are areas that have roughly equal numbers of people
- Can be described by polygons
head(ward_sales)
  ward       lon      lat group order num_sales avg_price
1    1 -123.3128 44.56531   0.1     1       159  311626.9
2    1 -123.3122 44.56531   0.1     2       159  311626.9
3    1 -123.3121 44.56531   0.1     3       159  311626.9
4    1 -123.3119 44.56531   0.1     4       159  311626.9
5    1 -123.3119 44.56485   0.1     5       159  311626.9
6    1 -123.3119 44.56430   0.1     6       159  311626.9
Drawing polygons is tricky
- Order matters

Drawing polygons is tricky
- Order matters
- Some areas may need more than one polygon

Predicted house prices
head(preds)
        lon      lat predicted_price
1 -123.3168 44.52539        258936.2
2 -123.3168 44.52740        257258.4
3 -123.3168 44.52940        255543.1
4 -123.3168 44.53141        253791.0
5 -123.3168 44.53342        252002.4
6 -123.3168 44.53542        250178.7
Let's practice!
Visualizing Geospatial Data in R

