Case study part II: Visualization

Introduction to Network Analysis in Python

Eric Ma

Data Carpentry instructor and author of nxviz package

nxviz API

import networkx as nx
import nxviz as nv
G = nx.erdos_renyi_graph(n=20, p=0.3)

circ = nv.circos(G, node_color_by='key', sort_by='key')
Introduction to Network Analysis in Python

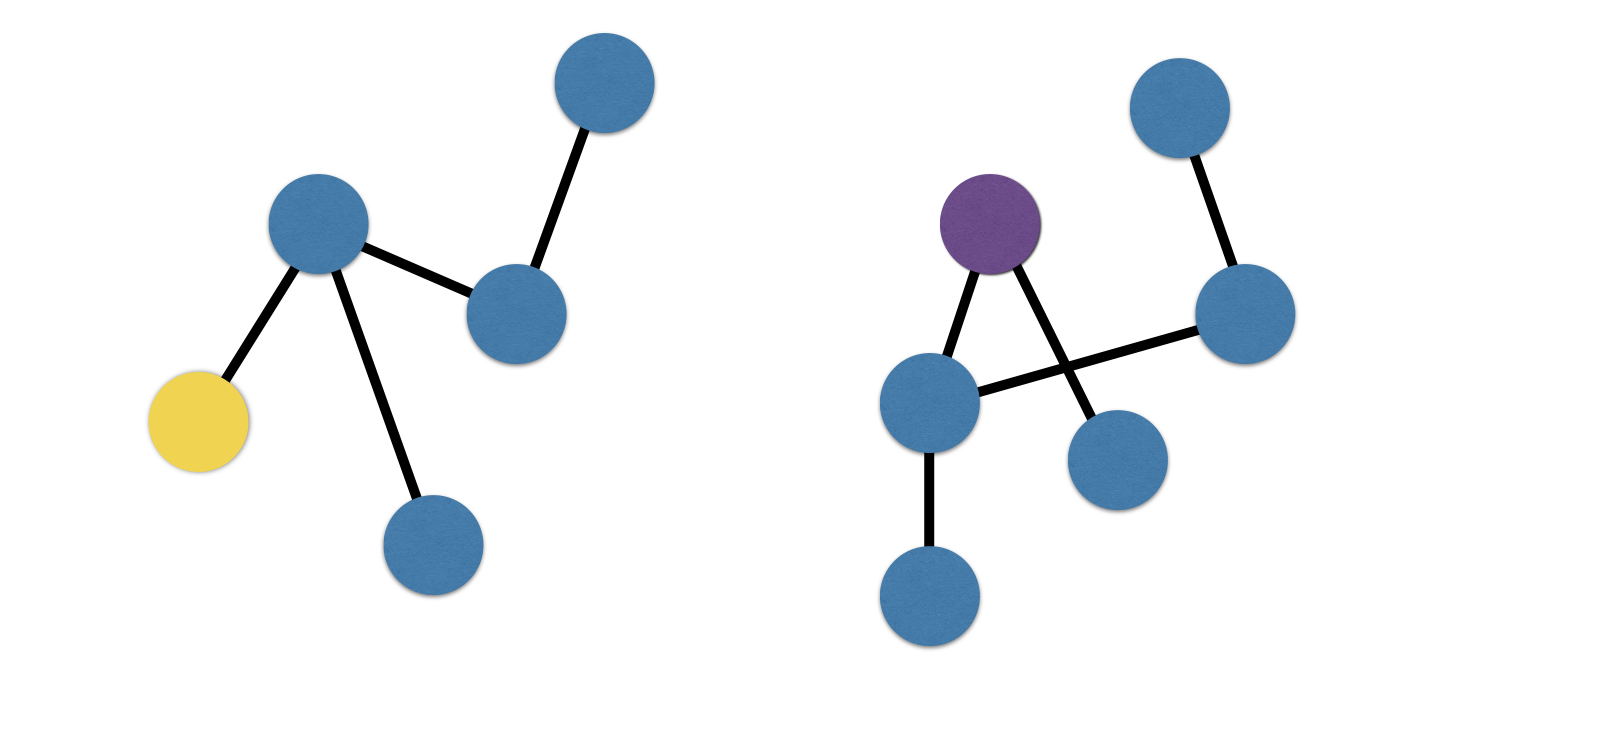
Connected component graphs

A graph consisting of two subgraphs, where node in each subgraph are connected to other nodes, but each subgraph is not connected to the other subgraph.

Introduction to Network Analysis in Python

NetworkX API

import networkx as nx
G = nx.erdos_renyi_graph(n=100, p=0.03)

nx.connected_components(G)
<generator object connected_component_subgraphs at 0x10cb2c990>
list(nx.connected_components(G))
[<networkx.classes.graph.Graph at 0x10ca24588>,
 <networkx.classes.graph.Graph at 0x10ca244e0>]
for g in list(nx.connected_components(G)):
    print(len(g.nodes()))
99
1
Introduction to Network Analysis in Python

Let's practice!

Introduction to Network Analysis in Python

Preparing Video For Download...