Alternative measures of risk
Introduction to Portfolio Analysis in Python

Charlotte Werger
Data Scientist
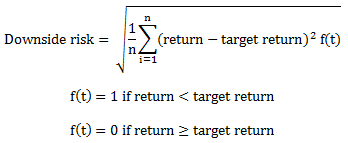
Looking at downside risk
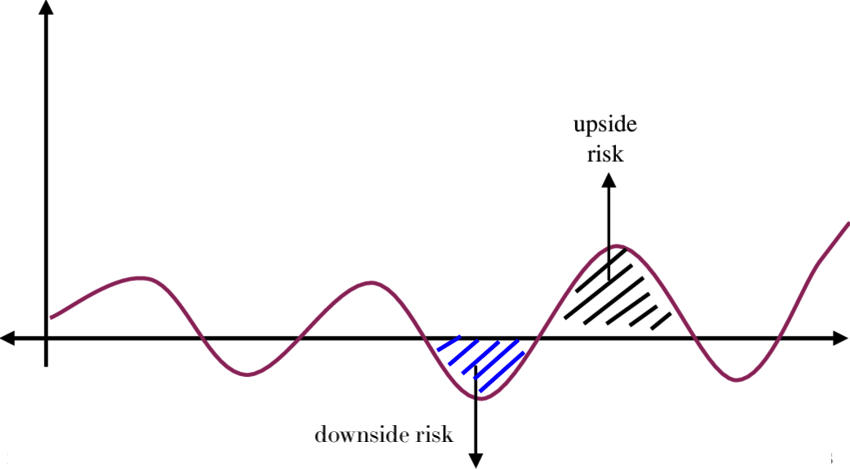
- A good risk measure should focus on potential losses i.e. downside risk
Sortino ratio
$$
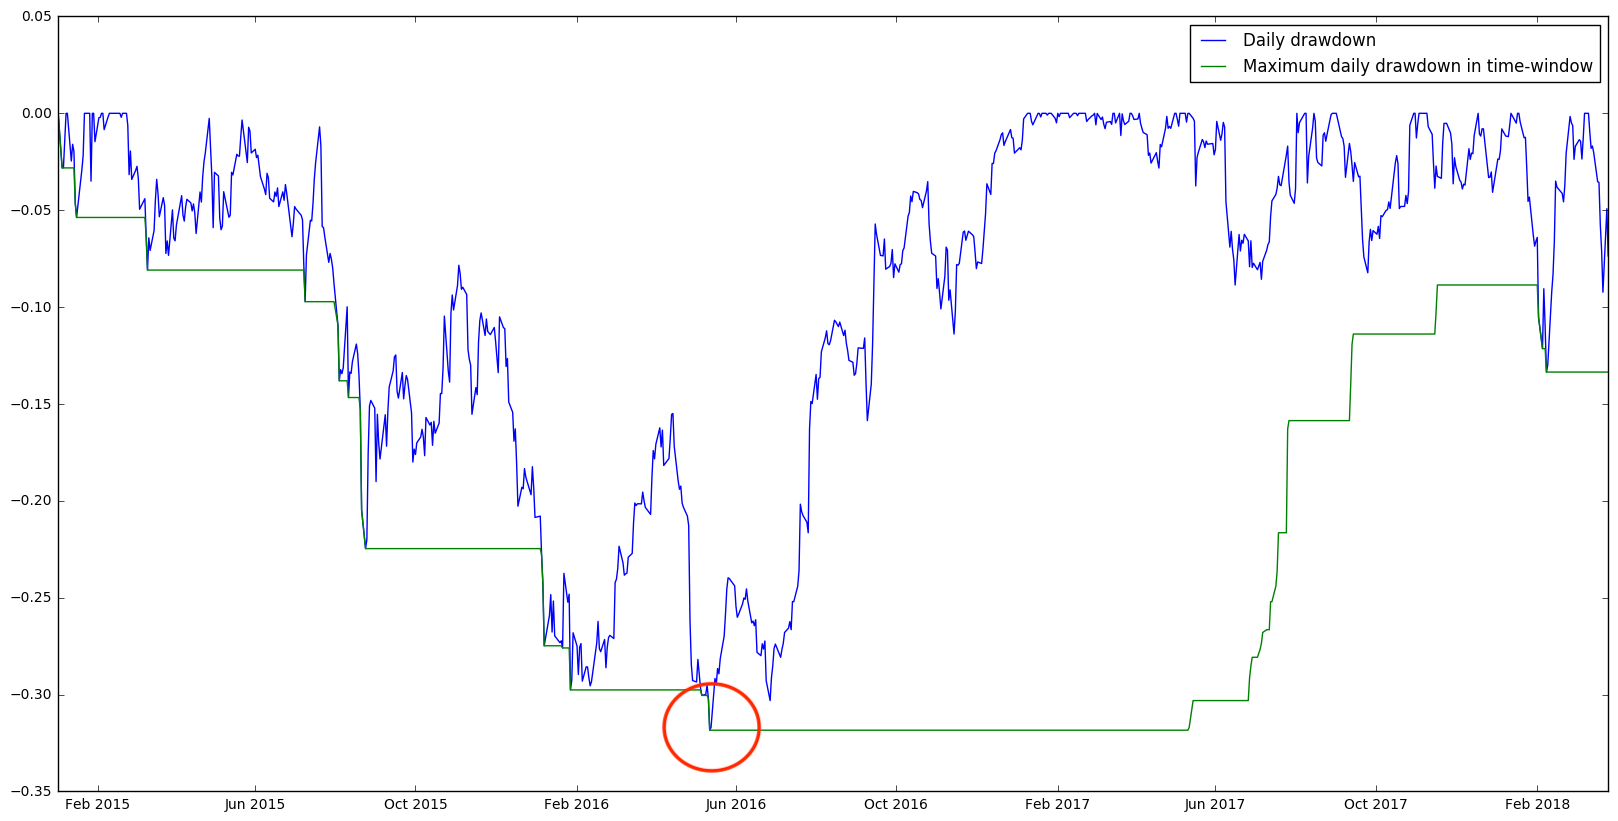
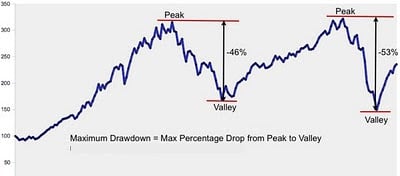
Maximum draw-down
- The largest percentage loss from a market peak to trough
- Dependent on the chosen time window
- The recovery time: time it takes to get back to break-even
Maximum draw-down of Apple