Measuring risk of a portfolio
Introduction to Portfolio Analysis in Python

Charlotte Werger
Data Scientist
Risk of a portfolio
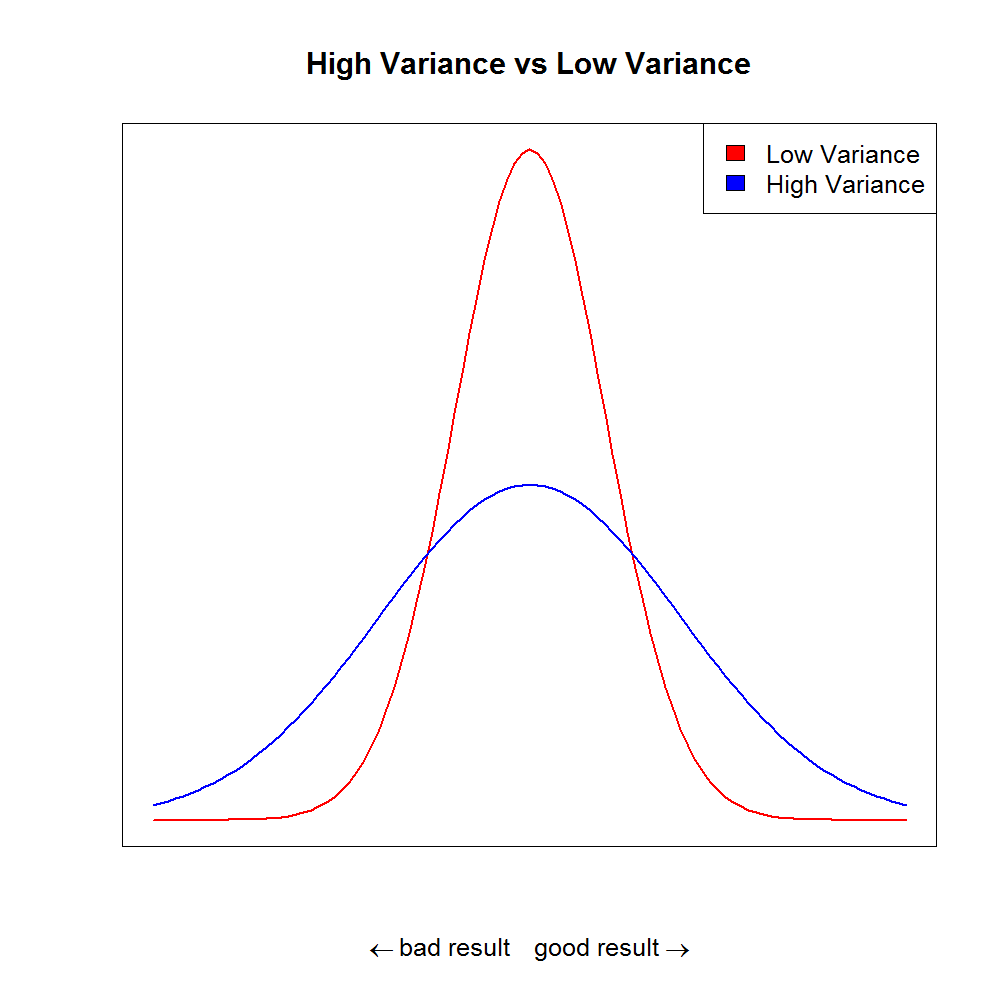
- Investing is risky: individual assets will go up or down
- Expected return is a random variable
- Returns spread around the mean is measured by the variance $\sigma^2$ and is a common measure of volatility
- $\sigma^2 = \frac{\sum\limits_{i=1}^N (X -\mu)^2}{N}$

Variance
Calculating portfolio variance
$$
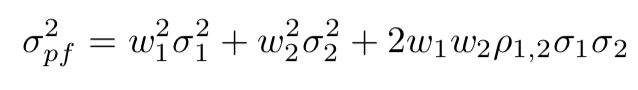
- $\rho_{1,2} \sigma_1 \sigma_2$ is called the covariance between asset 1 and 2
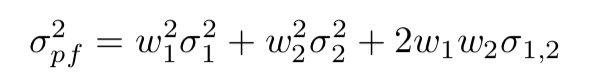
- The covariance can also be written as $ \sigma_{1,2} $
- This let's us write:
Re-writing the portfolio variance shorter
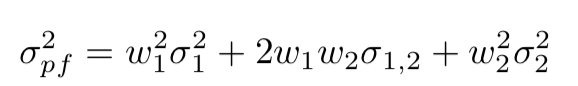
- This can be re-written in matrix notation, which you can use more easily in code:
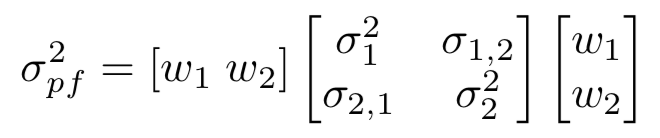
In words, what we need to calculate in python is:
Portfolio variance = Weights transposed x (Covariance matrix x Weights)

